Wastewater treatment blower selection – How to interpret the fan curve?
3 Minute Water and Waste Water Video Tutorials by AET
For more information or comments contact us here: https://www.aqua-equip.com/
Water testing equipment here: https://www.ebay.com/str/watertesting
Aeration is a major component of most wastewater treatment processes and accounts for close to 50% of all power costs at WWTPs. It used for oxygen supply of microorganisms, mixing purposes, air stripping and other applications. Therefore, the selection of the right blower type and size is the key for proper functioning of wastewater treatment processes and energy savings.
After calculating the required airflow volume (see pop up banner for calculation example) the blower/ fan curve is the most important design criteria for the selection of the right blower.
The fan curve diagram consists of 3 axes:
Horizontal Axis = Air Volume Flow Rate (CFM or m3/sec.)
Left Axis = Static Pressure (inches water gauge [wg], pascals [Pa], or mm water gauge)
Right Axis = Brake Horsepower (BHP or KW)
The blower diagram usually consists of two curves: The CFM vs. SP curve showing the relation between the static pressure compared to the air volume flow rate. The CFM vs BHP curve showing the relation between the fan’s air volume flow rate and the brake horsepower.
A typical blower used in wastewater treatment is a direct drive, centrifugal type blower. The little section which is almost flat is called the stall region which is the range where the blower is instable and should not be operated.
STEP 1
Draw a vertical line upwards from the calculated CFM amount – 2,000 in our case - until it intersects with the fan curve.
STEP 2
Calculate the required fan pressure depending on the water depth (PSIA) of the WWTP basin and atmospheric pressure (PSIG). One PSIA equals approximately 27.5 inch of water depth. As an example, lets take a water depth of 15ft and an altitude of 0ft which equals a PSIA of 6.5.
Then draw a horizontal line from the left axis until it intersects with the first line. When the intersection of these two lines is not right on the fan curve, you will need to calculate or approximate a System Curve and redraw the fan curve at a different RPM level. (short break)
In our case we will just approximate the system curve. The system curve always has a parabola shape starting at 0 and going through the determined intersection of SP and CFM.
STEP 4
Finally, to determine the required blower HP draw a vertical line up from the point where the System Curve intersects the CFM vs SP Curve to where it crosses the CFM vs BHP Curve. In our example the required HP is 40. The blower capacity should include about 50% safety therefore we select a blower with a higher HP of 65.
Видео Wastewater treatment blower selection – How to interpret the fan curve? канала Karl-Uwe Schmitz
Показать
Комментарии отсутствуют
Информация о видео
Другие видео канала
 Activated sludge process and IFAS - Design rules + guideline
 Proper fan selection
 Lamella clarifier guideline - tube settler design and CFD simulation
 Fixed bed biofilm reactor (FBBR) - operating principle and advantages
 Blower impeller design experiments
 What is fine bubble aeration and how does it work in wastewater treatment?
 Pump Chart Basics Explained - Pump curve HVACR
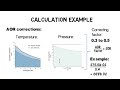 Oxygen transfer rate in Wastewater treatment - calculation example
 Top 12 Mistakes in Aquaponics Systems & How to Avoid them
 A Day In the Life: Wastewater Treatment Operators
 5 Common Questions on Water Treatment Operator Certification Exam
 Sewage Treatment Plant troubleshooting | tutorial
 Difference between Fan, Blower and Compressor
 Activated sludge process - Upgrade with IFAS
 BOD (biological oxygen demand) - The water quality indicator
 Film fill plastic media and attached biofilm growth I Wastewater treatment
 BIOROCK®, the best compact sewage treatment without electricity, zero energy. 25 years warranty!
 DIY: Trickle Filter Mini | Overhead aquarium sump
 Clarifier sludge scraper mechanism - sludge removal from clarifiers
 Waste Water Treatment -SCADA - Plant-IQ