Ichimoku Cloud Indicator: Best Trading Strategy for Beginners
Ichimoku Cloud indicator is one of the best indicators for beginners. In this tutorial, I explained how to use them while trading.
How to Trade Moving Averages: https://youtu.be/csxPNhV-na0
How to Trade Fibonacci Levels: https://youtu.be/q-E9l_7R_rc
If you have any questions, shoot them in the comments, I reply to everything.
Also, please leave a comment about any video you want me to make.
Binance referral with %10 discount: https://www.binance.com/en/register?ref=FTR9BIDH
Click to buy the best cryptocurrency wallet ever: https://shop.ledger.com/?r=060174241c06
The easiest way to buy cryptocurrencies with your credit card: https://cex.io/r/0/up110275514/0/
THIS IS NOT INVESTMENT ADVICE. I am not a financial advisor, videos in this channel are just for educational purposes.
Ichimoku Cloud is considered as the best indicator for the new traders. But when you look at it, it looks like a total mess. So it is really hard to understand why it is so popular, right? If you are a new trader who is seeing this indicator for the first time, don’t be scared because in this video I will try to explain it, and after learning it, you can really benefit from this indicator. After I explain it, you will see that it is not that complicated at all. After teaching the indicator, I will show you one simple strategy you can use with the Ichimoku cloud indicator.
Welcome to the Trading Journal channel and please don’t forget to subscribe and like for more trading and investing videos.
Ichimoku Cloud is called the best indicator for the new traders for a couple of reasons. I learned this indicator back in college while I was doing an exchange year. I took a trading lesson and my professor was one of the best traders I have ever met in my life. I was spending time chatting with him after the lessons and he was the person who taught me this strategy. Thanks to him, unlike my classmates, I was not taking many trades and losing money from my demo account. He called this strategy, the best one for new traders because it is too picky and it has strict rules.
So, unlike the RSI or the Bollinger Bands, you cannot do the mistake of opening tons of trades whenever the price reaches a certain level. Ichimoku cloud is way harder to read than those indicators but it is way easier to execute trades. So, the first advantage of the Ichimoku cloud indicator is since it is too picky, you will have less false signals and you will have less losing trades.
The second advantage is since it is hard to read and since you will have fewer trades, it will make you a more disciplined trader. Okay, enough motivation talk about the indicator, now let’s look at it part by part.
Here, I will show you how to apply the Ichimoku cloud on tradingview. On the top menu, you will click on the indicators and strategies section, and from the opening window, we will search for the Ichimoku cloud. It looks like a mess, right? I hope after seeing this video you won’t think that way. Okay, I will open the settings and we will start from the starch. Let’s lose everything and start from the lines.
Let’s start with this blue line which is called the conversion line. The conversion line is simply the short-term moving average which is also known as the turning line. Second, we have the baseline. It is the red line here, and it is the longer-term moving average. And, it is also known as the confirmation line. If you watched our video about the moving averages, you should remember that averages can act as support and resistance. If you haven’t watched the video already, you can find a link to it in the description box. These 2 lines are really important because, in our strategy, they will give us the entry signals.
The third line is called the lagging span. The lagging span shows us the price but as you can see, it is coming from behind, that’s the reason it is called the lagging span. It is used for the confirmation of signals. If the lagging span is away from the current price, the market is considered in a strong trend. But the lagging span is usually not used by many traders, since it is a lagging indicator. In our trading strategy, we will use it for confirmation.
Finally, we have the most important tool of the indicator: it is the Kumo Cloud. Cloud has two lines, the red line and the green one. They are known as span a and the span b but you don’t need to know their names or how are they calculated. But you should know that these clouds act as major support or resistance levels. So, in our strategy, if the price is above the cloud, we will only look to buy. And, we will only look to sell if the price is below the clouds. We will never trade if the price is inside the clouds.
Видео Ichimoku Cloud Indicator: Best Trading Strategy for Beginners канала Trading Journal
Показать
Комментарии отсутствуют
Информация о видео
Другие видео канала
 How to Read Japanese Candlestick Charts for Beginners
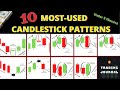 10 Most-used Candlestick Patterns Explained in 5 minutes
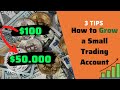 Growing a Small Trading Account: 3 Tips
 2021 TradingView Tutorial (For BEGINNERS) - My TradingView Setup for Technical Analysis
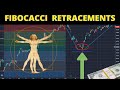 How to Trade Fibonacci Levels (MUST KNOW): Fibonacci + MACD
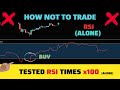 How Not to Trade? Tested the RSI Indicator Alone x100 Times
 Profitable Intraday Trading Strategy: Engulfing Pattern + RSI + EMA
 My Secret Trading Strategy: Double RSI Divergence (Multi-timeframe Regular + Hidden Divergence)
 Highly Profitable Day Trading Strategy: Heikin Ashi + Parabolic Sar + EMA
 Awesome Oscillator Trading Guide: 2 Super-Simple Strategies for Day Trading
 Most Profitable Supertrend Strategy for Daytrading (Full Supertrend Indicator Tutorial)
 The Easiest 1-Minute Scalping Strategy: 3-EMA Trading Strategy
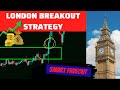 Best London Breakout Strategies for Daytrading Forex Market (London Breakout Strategy Tutorial)
 How to Trade Moving Averages: EMA vs SMA ✔️
 Binance Tutorial 2022: How to Buy/Sell/Trade Bitcoin & Cryptocurrencies
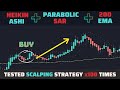 Tested the Day Trading Strategy x100 Times: Heikin Ashi + Parabolic Sar + EMA
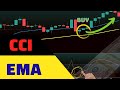 🔵 CCI Indicator Swing Trading Strategy: CCI Moving Average Forex Trading Strategy
 Williams Alligator Indicator: How to Day Trade with 2 Profitable Strategies
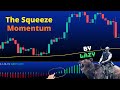 Most Popular Indicator Ever: Squeeze Momentum Indicator (by Lazybear) - Catching Breakouts Tutorial
 Can You Make Money with MACD? I Risked MACD Trading Strategy 100 TIMES
 Easy 5-minute Trading Strategy for Beginners: Stochastic + Double EMA