- Популярные видео
- Авто
- Видео-блоги
- ДТП, аварии
- Для маленьких
- Еда, напитки
- Животные
- Закон и право
- Знаменитости
- Игры
- Искусство
- Комедии
- Красота, мода
- Кулинария, рецепты
- Люди
- Мото
- Музыка
- Мультфильмы
- Наука, технологии
- Новости
- Образование
- Политика
- Праздники
- Приколы
- Природа
- Происшествия
- Путешествия
- Развлечения
- Ржач
- Семья
- Сериалы
- Спорт
- Стиль жизни
- ТВ передачи
- Танцы
- Технологии
- Товары
- Ужасы
- Фильмы
- Шоу-бизнес
- Юмор
Chi square
Chi-Square Test
The chi-square test is a statistical test used to determine whether there is a significant association between two categorical variables. It's commonly used in research to analyze data and test hypotheses.
What is the Chi-Square Test?
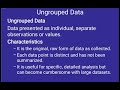
he chi-square test is a non-parametric test that calculates the difference between observed frequencies and expected frequencies in a contingency table. The test statistic is calculated as the sum of the squared differences between observed and expected frequencies, divided by the expected frequencies.
When to Use the Chi-Square Test
The chi-square test is used in the following situations:
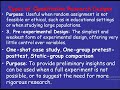
1. Testing for independence: To determine whether there is a significant association between two categorical variables.
2. Testing for goodness of fit: To determine whether the observed frequencies fit a specific distribution.
How to Calculate the Chi-Square Test
The chi-square test statistic is calculated using the following formula:
χ² = Σ [(observed frequency - expected frequency)^2 / expected frequency]
Where:
- χ² is the chi-square test statistic
- observed frequency is the frequency observed in the sample
- expected frequency is the frequency expected under the null hypothesis
Interpretation of ResultsThe chi-square test produces a test statistic and a p-value. The p-value indicates the probability of observing the test statistic under the null hypothesis. If the p-value is below a certain significance level (usually 0.05), the null hypothesis is rejected, and it is concluded that there is a significant association between the variables.
Example
Suppose we want to investigate whether there is a significant association between gender and favorite type of music. We collect data from 100 participants and create the following contingency table:
| | Rock | Pop | Hip-Hop | Total |
| | ---- | --- | ------- | ----- |
| Male | 20 | 15 | 10 | 45 |
| Female | 10 | 25 | 20 | 55 |
| Total | 30 | 40 | 30 | 100 |
To calculate the chi-square test statistic, we need to calculate the expected frequencies under the null hypothesis of independence. Let's assume the null hypothesis is that there is no significant association between gender and favorite type of music.
The expected frequencies would be:
| | Rock | Pop | Hip-Hop | Total |
| | ---- | --- | ------- | ----- |
| Male | 13.5 | 18 | 13.5 | 45 |
| Female | 16.5 | 22 | 16.5 | 55 |
| Total | 30 | 40 | 30 | 100 |
The chi-square test statistic would be calculated as:
χ² = [(20-13.5)^2 / 13.5] + [(15-18)^2 / 18] + [(10-13.5)^2 / 13.5] + [(10-16.5)^2 / 16.5] + [(25-22)^2 / 22] + [(20-16.5)^2 / 16.5]
χ² = 6.34 + 1.39 + 2.35 + 2.55 + 1.14 + 1.69
χ² = 15.46
The p-value associated with the chi-square test statistic would indicate the probability of observing the test statistic under the null hypothesis. If the p-value is below 0.05, we would reject the null hypothesis and conclude that there is a significant association between gender and favorite type of music.
Conclusion
The chi-square test is a useful statistical test for determining whether there is a significant association between two categorical variables. By understanding how to calculate and interpret the chi-square test, researchers can gain insights into the relationships between variables and make informed decisions.
Видео Chi square канала Think vista with Dr Aqeel and Nagina khan
The chi-square test is a statistical test used to determine whether there is a significant association between two categorical variables. It's commonly used in research to analyze data and test hypotheses.
What is the Chi-Square Test?
he chi-square test is a non-parametric test that calculates the difference between observed frequencies and expected frequencies in a contingency table. The test statistic is calculated as the sum of the squared differences between observed and expected frequencies, divided by the expected frequencies.
When to Use the Chi-Square Test
The chi-square test is used in the following situations:
1. Testing for independence: To determine whether there is a significant association between two categorical variables.
2. Testing for goodness of fit: To determine whether the observed frequencies fit a specific distribution.
How to Calculate the Chi-Square Test
The chi-square test statistic is calculated using the following formula:
χ² = Σ [(observed frequency - expected frequency)^2 / expected frequency]
Where:
- χ² is the chi-square test statistic
- observed frequency is the frequency observed in the sample
- expected frequency is the frequency expected under the null hypothesis
Interpretation of ResultsThe chi-square test produces a test statistic and a p-value. The p-value indicates the probability of observing the test statistic under the null hypothesis. If the p-value is below a certain significance level (usually 0.05), the null hypothesis is rejected, and it is concluded that there is a significant association between the variables.
Example
Suppose we want to investigate whether there is a significant association between gender and favorite type of music. We collect data from 100 participants and create the following contingency table:
| | Rock | Pop | Hip-Hop | Total |
| | ---- | --- | ------- | ----- |
| Male | 20 | 15 | 10 | 45 |
| Female | 10 | 25 | 20 | 55 |
| Total | 30 | 40 | 30 | 100 |
To calculate the chi-square test statistic, we need to calculate the expected frequencies under the null hypothesis of independence. Let's assume the null hypothesis is that there is no significant association between gender and favorite type of music.
The expected frequencies would be:
| | Rock | Pop | Hip-Hop | Total |
| | ---- | --- | ------- | ----- |
| Male | 13.5 | 18 | 13.5 | 45 |
| Female | 16.5 | 22 | 16.5 | 55 |
| Total | 30 | 40 | 30 | 100 |
The chi-square test statistic would be calculated as:
χ² = [(20-13.5)^2 / 13.5] + [(15-18)^2 / 18] + [(10-13.5)^2 / 13.5] + [(10-16.5)^2 / 16.5] + [(25-22)^2 / 22] + [(20-16.5)^2 / 16.5]
χ² = 6.34 + 1.39 + 2.35 + 2.55 + 1.14 + 1.69
χ² = 15.46
The p-value associated with the chi-square test statistic would indicate the probability of observing the test statistic under the null hypothesis. If the p-value is below 0.05, we would reject the null hypothesis and conclude that there is a significant association between gender and favorite type of music.
Conclusion
The chi-square test is a useful statistical test for determining whether there is a significant association between two categorical variables. By understanding how to calculate and interpret the chi-square test, researchers can gain insights into the relationships between variables and make informed decisions.
Видео Chi square канала Think vista with Dr Aqeel and Nagina khan
Комментарии отсутствуют
Информация о видео
21 октября 2025 г. 6:50:35
00:08:19
Другие видео канала