Activity Diagram - Step by Step Guide with Example
In this video, you’re going to learn
1. What is the Activity Diagram?
2. How to draw an activity diagram?
3. Step by step with examples.
One of the other important diagrams in UML is the Activity Diagram which shows a dynamic view of the system. The activity diagram is a flowchart to represent the flow of control among the activities in a system. Simply, it’s an operation of the system shown in the diagrammatical form where it shows all the control flow from one operation to another.
So far we have gone through the use case diagram, communication, sequence, and class diagram which shows the message flow from one object to another but in the activity diagram shows the message flow from one activity to another.
The flow of operation can be sequential, branched or concurrent. The activity diagram is sometimes considered as the flowchart. Although the diagrams look like a flowchart, they are not. Now let’s move to learn different notations used in the activity diagram.
1. Start Node: The black small filled circle is the standard notation for an initial state before an activity takes place. In the flow chart we draw in an oval shape label with Start whereas in the activity diagram we draw with fill small circle as shown in the diagram to represent the start of the activity.
2. Final Activity node: The Black circle that looks like a selected radio button is the symbol for the end state of activity. In the flow chart we represent in oval shape label with the end in it whereas in the activity diagram we represent with small fill circle include borderline circle as shown in the figure.
3. Activity: The activity symbols are the basic building blocks of an activity diagram and usually have a short description of the activity they represent. It is represented by the oval shape as well as a round-edged rectangle box as shown in the figure.
4. Control Flow: A solid line with an arrow represent the direction flow of the activities. The arrow points in the direction of progressing activities.
5. Join: A join combines two concurrent activities back into a flow where only one activity is happening at a time which is represented as shown in the figure.
6. Fork: A fork splits single activity flow into two concurrent activities which are represented.
7. Decision Symbol: It is similar to the flow chart which is represented by the diamond shape where two paths coming out of a decision and the condition text lets you know which options are mutually exclusive.
8. Condition: condition text is placed next to a decision marker to let you know under what condition an activity flow should split off in that direction.
9. Merge Node: Merge is similar to the join where two activities are merged with the condition and only one activity flows forward as shown in the figure. For example: While Sending E-mail, if the email is private, encrypted it before sending it while if not private, send as regular mail. These two activities are merged with the merge node which is the same as the decision represented by a diamond shape. In Decision one activity as input and there will be two output according to a condition whereas in merge two activities are input and output only one activity.
10. Final Flow node: It may be confusing with the final activity node. It represents the end of a specific process flow which is denoted by a circle with cross lines inside the circle.
11. Partition: activity diagram partition is also known as swim lanes which are used to represent or group actions carried out by different actors in a single thread.
12. Note: or Comment: This is similar to the sequence diagram, used to add relevant comments to elements that are represented by one corner folded symbol.
Signal Sending which is used to represent the action of sending a single to an accepting activity
Signal receipt, which is used to represent that signal is received.
In this way, you can draw the activity diagram using a different kind of notation showing stepwise activities.
How to draw Use Case Diagram
https://www.youtube.com/watch?v=sQgoFjxSdxo
How to verify Use Case Diagram
https://www.youtube.com/watch?v=PiRsKDlZeVk
How to draw Communication or Collaboration Diagram
https://www.youtube.com/watch?v=Z_KPh5K_cC0
How to draw Sequence Diagram
https://www.youtube.com/watch?v=_Mzi1rYtI5U
SUBSCRIBE to our YouTube channel for more videos:
https://www.youtube.com/c/Master2Teach?sub_confirmation=1
Like us on Facebook: https://www.facebook.com/master2teach
For more content go to https://master2teach.com/
E-mail: master2teach@gmail.com
Видео Activity Diagram - Step by Step Guide with Example канала Master2Teach
Показать
Комментарии отсутствуют
Информация о видео
Другие видео канала
 UML 2.0 Activity Diagrams
 UML Use Case Diagram Tutorial
 Sequence Diagram - Step by Step Guide with Example
 UML Activity Diagram with solved example and notes(HINDI) || IGNOU || MCS-032
 The 9 Industries Most Likely To Make You A Millionaire
![Activity Diagram : How To Draw Using Only [6 Key Components]](https://i.ytimg.com/vi/u2cARAYzhJg/default.jpg) Activity Diagram : How To Draw Using Only [6 Key Components]
Activity Diagram : How To Draw Using Only [6 Key Components] How to make Sequence diagram with example
 Modeling a simple Activity diagram
 Behaviour Modeling: Activity diagrams
 Project Login module | Activity diagram بالعربي
 Use Case Diagram - Step by Step Tutorial with Example
 UML Activity Diagram with solved example | Urdu / hindi - Full detail
 UML Sequence Diagram for beginner with Solved Example in Hindi | SOOAD Series
 UML Class Diagram Tutorial
 Activity Diagram with example
 Use Case Diagram - Step by Step Checklist with Example
 Activity diagram with example
 UML activity diagrams
 Activity Diagram Part-1 Explained in Hindi l UML Diagram l Software Modeling and Designing Course
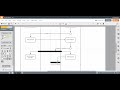 Activity Diagram in Lucidchart