Quantified Self: Hand Drawn Data Visualisations
In previous webinars we have discussed different use cases around Quantified Self, this webinar will go one step further and show you some more real world examples on Hand Drawn Data Visualisations, with data that has been manually collected. This webinar features Sophie Sparkes and Andy Kriebel from The Information Lab, but we also have a special guest from Tableau, Taha Ebrahimi.
Links
Reporter App
IFTTT / Zapier
Noter (Whiteboard)
DaVinci Eye App
https://datame.app/
Data-chain.com
----------------------------------------------------------------------------------------------------
Want more information about us? Head over to theinformationlab.co.uk
Want to see more of our events? Head over to til.bi/talkdata to find out more
----------------------------------------------------------------------------------------------------
Видео Quantified Self: Hand Drawn Data Visualisations канала The Information Lab
Показать
Комментарии отсутствуют
Информация о видео
Другие видео канала
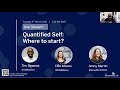 Quantified Self: Where to start ?
 Tableau Calculations & Alteryx Predictive & Spatial
 Webinar: A Little Obscure, a Little Random and a Lot Useful - Tableau Techniques
 Quantified Self: You have the data, now what?
 Photoshop for Beginners | FREE COURSE
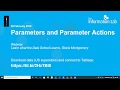 Perfect Parameters and Parameters Actions in Tableau
 Data School 7 - Tips and tricks
 Webinar: Alteryx Intelligence Suite for Analysts
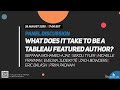 What Does it Take to be a Tableau Public Featured Author?
 How to Design a Logo - Full Identity Design Course
 April Series | Building Virtual Classes Using Google Classroom
 Set Actions in Tableau
 Analytics in the Cloud: Build a cloud data lake from your SAAS platforms
 3 Ways to do Sentiment Analysis in Alteryx
 How to in Tableau in 5 mins: Shade Between Two Lines in Tableau
 See What’s New in Tableau 2020.1
 How to in Tableau in 5 mins: Create Compact Bar Charts
 Understanding sporting event revenue: How to maximise attendee spend at an event
 The first 20 hours -- how to learn anything | Josh Kaufman | TEDxCSU