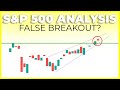
SP500 BULL TRAP WARNING SIGN (Keep An Eye On This Chart) | S&P 500 Technical Analysis
This is the Most important SP500 (S&P 500) Technical Analysis to date. I will be talking about a leading indicator for the S&P 500 that warned us of the stock market crash that took place February 2020, and how that indicator is once again flashing a red warning sign.
The warning sign that i am talking about is the 10yr treasury bond. When there is a divergence between the 2 the 10 yr bond typically give us a head start as to what will take place in the stock market which can help technical traders and investors forecast the current stock market.
By no means is this a end all be all indicator, however when we see this type of spread take place as shown on the FRED chart we typically see the SP500 shortly thereafter follow the 10 yr treasury bonds lead.
PLEASE NOTE: the FRED chart is the 10yr minus the 2 yr government bond. The support line mapped on the candlestick chart is of just the 10 yr bond. Still in my personal opinion is very relevant.
The FRED Chart Comparison:
https://fred.stlouisfed.org/graph/?g=74l2
MY FAVORITES - https://amz.run/3JLv
○ Book Recommendations
○ My Studio Setup
○ Morning Coffee
STOCK TRADING PLATFORM
○ Webull (GET 2 FREE STOCKS): https://bit.ly/37wobNT
COME SAY HI:
Instagram: https://www.instagram.com/figuringoutmoney
Twitter: https://twitter.com/mikepsilva
Make sure to SUBSCRIBE to my channel!
DISCLAIMER: I am not a professional investment advisor, nor do I claim to be. All my videos are for entertainment and educational purposes only. This is not trading advice. I am wrong all the time. Everything you watch on my channel is my opinion. Links included in this description might be affiliate links. If you purchase a product or service with the links that I provide I may receive a small commission. There is no additional charge to you! Thank you for supporting my channel :)
Видео SP500 BULL TRAP WARNING SIGN (Keep An Eye On This Chart) | S&P 500 Technical Analysis канала Figuring Out Money
Показать
Комментарии отсутствуют
Информация о видео
Другие видео канала
 SP500 FALSE BREAKOUT WARNING SIGN (Stock Market Still In Bullish Context ) | S&P Technical Analysis
 Why the Banks Will Crash Stocks
 SP500 TRADING STRATEGY (Risk Vs. Reward Setup) | S&P 500 Technical Analysis
 Are the BANKS Going To CRASH The Stock Market Again? GFC RERUN S&P 500 Technical Analysis 14.07.2020
 WARNING: Tech Stocks In Bubble 2.0 (FANGMAN Over Extended) | NASDAQ (NDX) 100 Technical Analysis
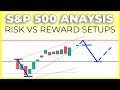 SP500 PULLBACK TO 3100 LOOKS PROBABLE (My Thought Process) | S&P 500 Technical Analysis
 8 Stocks To Buy & Stocks To Watch For Swing & Day Trading Using Technical Analysis | Weekly Scan #20
 SP500 Long Term Analysis | Macro and Technical
 TESLA STOCK CREATES FOMO ON S&P 500 NEWS | TSLA Technical Analysis
 When Will The Stock Market Crash?
![Buy or Sell The Stock Market This Week? [S&P 500 Technical Analysis 19.07.2020]](https://i.ytimg.com/vi/k9cHnjN35wk/default.jpg) Buy or Sell The Stock Market This Week? [S&P 500 Technical Analysis 19.07.2020]
Buy or Sell The Stock Market This Week? [S&P 500 Technical Analysis 19.07.2020] Stock Market CRASH Ahead lead by Nasdaq & Apple
 MARKET UPDATE: S&P 500 FUTURES ARE UPP AGAIN!! | TECHNICAL ANALYSIS ON S&P 500 INDEX (SPX) (US100)
 SP500 WOLF IN SHEEP'S CLOTHING APPEARS AT END OF TRADING DAY | S&P 500 Technical Analysis
 How Should We Read Today's Tape With The Late Decline?
 Stocks To Buy & Stocks To Watch For Swing Trading & Day Trading Technical Analysis | Weekly Scan #20
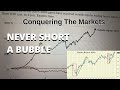 NEVER SHORT A BUBBLE - S&P 500 Technical Analysis: STOP Trying To Pick The TOP
 Why the weekly close is so important...
 Why The Market Could Crash Around July 31st
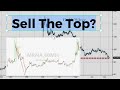 S&P At Critical Resistance. Are You Shorting a 5 Month High? - Technical Analysis: Market View