- Популярные видео
- Авто
- Видео-блоги
- ДТП, аварии
- Для маленьких
- Еда, напитки
- Животные
- Закон и право
- Знаменитости
- Игры
- Искусство
- Комедии
- Красота, мода
- Кулинария, рецепты
- Люди
- Мото
- Музыка
- Мультфильмы
- Наука, технологии
- Новости
- Образование
- Политика
- Праздники
- Приколы
- Природа
- Происшествия
- Путешествия
- Развлечения
- Ржач
- Семья
- Сериалы
- Спорт
- Стиль жизни
- ТВ передачи
- Танцы
- Технологии
- Товары
- Ужасы
- Фильмы
- Шоу-бизнес
- Юмор
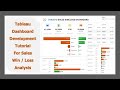
Power BI Telecom Business and Customer Analysis Dashboard Tutorial for Beginners
Learn how to build a powerful telecom customer analysis dashboard in Power BI! This beginner-friendly tutorial walks you through creating KPIs, using filters, designing correlation charts, and building tree map visuals for ad-hoc and self-service analysis.
Whether you're new to Power BI or looking to sharpen your data visualization skills, this video will help you:
Create dynamic KPIs with filters
Visualize customer data using correlation charts
Build tree maps for quick insights
Understand key metrics in telecom analytics
Design dashboards for business decision-making
🔍 Perfect for analysts, business users, and anyone exploring Power BI for telecom data.
📌 Don't forget to like, subscribe, and comment if you find this helpful!
Connect with me:
LinkedIn - https://www.linkedin.com/in/abhishek-agarwal-9549876/
Twitter - https://x.com/agarrwal7
Need Advance Dashboard Training? Contact - abhishek.agarrwal@gmail.com
Advance Dashboard Training Details - https://docs.google.com/presentation/d/1ArqwjW9F-1Q-Zz2wV0SxwUrp8G_Cn8ScP4pi1v9wkhw/edit?usp=sharing
Join my private group for dataset and communcations - https://tinyurl.com/yd65vnf3
Tutorials Sheet - https://docs.google.com/spreadsheets/d/10xQxfEnCQXX1-uZd8TLo78nydaa2IvKZo_9p58F2BxM/edit?usp=sharing
Видео Power BI Telecom Business and Customer Analysis Dashboard Tutorial for Beginners канала Data Science Tutorials
Data Analysis for Beginners Business Intelligence Tools Data Visualization Tutorial KPI Dashboard Tutorial Power BI Correlation Chart Power BI Tree Map Power BI Filters Power BI Business Intelligence Telecom Analytics Telecom Dashboard Telecom Customer Analysis Telecom Data Visualization Power BI Self Service BI Power BI Tutorial Power BI for Beginners Power BI Dashboard Power BI Adhoc Analysis Power BI KPIs Power BI Metrics
Комментарии отсутствуют
Информация о видео
12 сентября 2025 г. 13:51:17
00:21:22
Другие видео канала