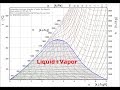
Explain Joule Thomson effect with Nitrogen TS diagram
Two-Phase Dome and Triple Point: 0:42
Ideal Gas Region: 1:30
Lines of Constant Entropy and Temperature: 1:45
Lines of Constant Pressure: 2:18
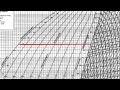
Lines of Constant Enthalpy: 3:45
Consider Throttling Processes
(a) to (b): 6:13
(c) to (d): 7:41
Discuss the T-s diagram for Nitrogen showing two-phase region, lines of constant pressure and enthalpy. For isenthalpic flow through restriction, discuss Joule-Thomson coefficent and how temperature can either increase, decrease or not change.
Видео Explain Joule Thomson effect with Nitrogen TS diagram канала Randall Manteufel
Ideal Gas Region: 1:30
Lines of Constant Entropy and Temperature: 1:45
Lines of Constant Pressure: 2:18
Lines of Constant Enthalpy: 3:45
Consider Throttling Processes
(a) to (b): 6:13
(c) to (d): 7:41
Discuss the T-s diagram for Nitrogen showing two-phase region, lines of constant pressure and enthalpy. For isenthalpic flow through restriction, discuss Joule-Thomson coefficent and how temperature can either increase, decrease or not change.
Видео Explain Joule Thomson effect with Nitrogen TS diagram канала Randall Manteufel
Показать
Комментарии отсутствуют
Информация о видео
Другие видео канала
 Making sense of temperature-entropy diagrams
 Joule-Thomson Effect
 How to make a Liquid nitrogen generator
 Throttle High-Pressure Water (Interactive Simulation)
 Joule Thomson effect in natural gas pipeline
 Refrigeration - Cycle for Ideal conditions on a Pressure Enthalpy Chart
 Applied Psychrometrics Webinar
 Why Do Compressed Air Cans Get Cold?
 Thermodynamics 49 : Joule Thompson Throttling / Adiabatic Cooling
 Intro Joule Thomson coefficient
 REFPROP Intro 2
 Making Liquid Nitrogen From Scratch!
 The Joule-Thomson effect
 Psychrometric process
 Conversion of PV diagrams into TS diagrams.
 Adiabatic Compression/Expansion: Enthalpy-Entropy Diagram
 h-s diagram of centrifugal compressor and its efficiency
 Linde's method of liquefaction | Joule Thomson Effect
 What's inside a Thermal Expansion Valve TXV - how it works hvac