- Популярные видео
- Авто
- Видео-блоги
- ДТП, аварии
- Для маленьких
- Еда, напитки
- Животные
- Закон и право
- Знаменитости
- Игры
- Искусство
- Комедии
- Красота, мода
- Кулинария, рецепты
- Люди
- Мото
- Музыка
- Мультфильмы
- Наука, технологии
- Новости
- Образование
- Политика
- Праздники
- Приколы
- Природа
- Происшествия
- Путешествия
- Развлечения
- Ржач
- Семья
- Сериалы
- Спорт
- Стиль жизни
- ТВ передачи
- Танцы
- Технологии
- Товары
- Ужасы
- Фильмы
- Шоу-бизнес
- Юмор
Stem-and-Leaf Plot Explained | See Data Distribution Clearly 📊 #datascience #stocks #dataanlysis
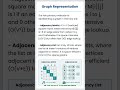
What is a Stem-and-Leaf Plot?
A stem-and-leaf plot is a simple statistical tool that displays the distribution of numerical data while preserving the original values.
It splits each number into two parts:
• Stem → the leading digit(s)
• Leaf → the last digit
Together, they form a visual representation similar to a histogram — but with the exact data values still visible.
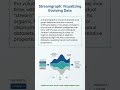
In this reel, you’ll learn:
• What a stem-and-leaf plot is
• How stems and leaves organize data
• Why it shows both distribution and original values
• When it’s useful for small to medium datasets
Example:
Score 85 → Stem 8, Leaf 5
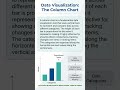
Key insight:
Stem-and-leaf plots reveal the shape, spread, and exact values of a dataset at the same time.
Follow for more structured and powerful learning reels.
#StemAndLeafPlot #Statistics #DataVisualization #DataScience #Analytics #DataDistribution #Learn404
Видео Stem-and-Leaf Plot Explained | See Data Distribution Clearly 📊 #datascience #stocks #dataanlysis канала Learn404
A stem-and-leaf plot is a simple statistical tool that displays the distribution of numerical data while preserving the original values.
It splits each number into two parts:
• Stem → the leading digit(s)
• Leaf → the last digit
Together, they form a visual representation similar to a histogram — but with the exact data values still visible.
In this reel, you’ll learn:
• What a stem-and-leaf plot is
• How stems and leaves organize data
• Why it shows both distribution and original values
• When it’s useful for small to medium datasets
Example:
Score 85 → Stem 8, Leaf 5
Key insight:
Stem-and-leaf plots reveal the shape, spread, and exact values of a dataset at the same time.
Follow for more structured and powerful learning reels.
#StemAndLeafPlot #Statistics #DataVisualization #DataScience #Analytics #DataDistribution #Learn404
Видео Stem-and-Leaf Plot Explained | See Data Distribution Clearly 📊 #datascience #stocks #dataanlysis канала Learn404
Комментарии отсутствуют
Информация о видео
14 марта 2026 г. 17:30:59
00:00:49
Другие видео канала