Debugging STM32 in STM32CubeIDE- Breakpoint and Live Expression
Learn Debugging STM32 Microcontroller in STM32CubeIDE. We’ll use ST-Link debugger of STM32 Nucleo Board. we’ll add breakpoint and then learn how to step through every line of the code. Also, we’ll monitor variable value in real time using live expression. This debugging technique is useful for professional firmware development.
[SUPPORT]
►► Try the world's most trusted PCB design software, Altium Designer with 365, for free and 25% off your purchase: https://www.altium.com/yt/binaryupdates
►► Learn about Altium 365, the electronics product design platform that unites PCB design, MCAD, data management, and teamwork: https://www.altium.com/altium-365
[RESOURCES]
►► Create STM32 Debugging Project: https://youtu.be/WLqUImiV5Gs
►► Need Help? To Learn Embedded Systems: https://courses.binaryupdates.com
[TIMESTAMPS]
00:00 Introduction
00:29 Code explanation
00:40 Start debugging
01:19 Add variable in live expression
02:12 Add breakpoint
02:45 Step-over, step-in
03:07 SWV Debugging
04:28 Disable breakpoint
05:38 Terminate debug session
05:49 Outro
Видео Debugging STM32 in STM32CubeIDE- Breakpoint and Live Expression канала BINARYUPDATES
Показать
Комментарии отсутствуют
Информация о видео
Другие видео канала
 Embedded System Design CareerPlus Course
 Microcontroller Masterclass Course- To Become a Professional
 AVR Fuse Bits Example: Setting Clock Source
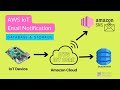 Amazon SNS and DynamoDB in AWS Cloud- Email Notification and Database
 Why learn PCB Design with Top 4- Reasons
 Learn Basics of Electricity and Solids- Part III
 Learn how a Breadboard works and How to use It?
 Setup Install Cygnus IDE for PlutoX Drone
 Eagle PCB Design: Setup and Installation
 Learn Basics of Electronic Circuit- Part IV
 Computer Vision with the Raspberry Pi4- OpenCV and Tesseract OCR
 SWITCH TO LPC2148 ARM7 MICROCONTROLLER
 Control LCD with Arduino: Build Cool Projects
 Learn Basics of Electricity and Electronics Part-II
 Solve Failed to fetch archives- Raspberry Pi4 Update and Upgrade Error
 Raspberry Pi4 Masterclass Course Build Real Live Use Cases
 RFID Reader RYRR10S with Arduino Tutorial
 Roles and responsibilities of an Embedded Systems Engineer
 Top-10 Industries for Embedded Systems Engineer- Job Opportunities
 LoRa Module with Arduino- REYAX RYLR998 Tutorial
 Add Switch to Arduino Project