Histogram Basics Explained | Learn Data Visualisation
📊 Histogram Basics Explained | Learn Data Visualisation
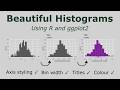
The histogram is a powerful plot that is used to visualise the distribution of data. It is widely applied by analysts and scientists to explore data and communicate results. The histogram is both simple to compute, and easy to interpret.
In this video you will learn:
✅ How to choose a bin width for your histogram.
✅ How to bin your data.
✅ How to construct a histogram step-by-step.
0:00 Introduction
1:03 Visualising distributions of data
1:56 Histogram bins & binning data
2:57 Choosing a bin width
5:07 Constructing a simple histogram
5:46 Summary & further topics
#histogram #statistics #datavisualization
Видео Histogram Basics Explained | Learn Data Visualisation канала Drawing Distributions
Комментарии отсутствуют
Информация о видео
27 марта 2025 г. 20:51:34
00:06:48
Другие видео канала