- Популярные видео
- Авто
- Видео-блоги
- ДТП, аварии
- Для маленьких
- Еда, напитки
- Животные
- Закон и право
- Знаменитости
- Игры
- Искусство
- Комедии
- Красота, мода
- Кулинария, рецепты
- Люди
- Мото
- Музыка
- Мультфильмы
- Наука, технологии
- Новости
- Образование
- Политика
- Праздники
- Приколы
- Природа
- Происшествия
- Путешествия
- Развлечения
- Ржач
- Семья
- Сериалы
- Спорт
- Стиль жизни
- ТВ передачи
- Танцы
- Технологии
- Товары
- Ужасы
- Фильмы
- Шоу-бизнес
- Юмор
DAX for Data Analysts: Top Sellers, Lowest Performers, Profit Leaders in Power BI
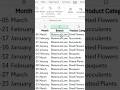
Learn how to master TOP N analysis in Power BI using DAX in this complete, step-by-step tutorial. In this video, we will go deep into identifying the top branch, lowest month, top product categories, top product names, highest-cost branch, month with highest gross margin, least used payment method, and most repeated grade — all using powerful DAX techniques.
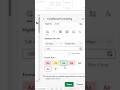
This detailed walkthrough teaches you how to use SUM, COUNT, VAR, IF, RANK X, ALL, and other essential DAX functions to solve real-world business problems. We start with calculating simple aggregations, then move to assigning ranks, and finally apply conditions to extract insights like top performers, lowest performers, and most repeated values.
You will learn:
• How to calculate Totals using SUM
• How to assign ranks using RANK X with ALL
• How to return Top 1, Top 2, Top 5 values using IF and logical tests
• How to combine multiple calculations inside a single measure using VAR
• How to find the month with the lowest quantity sold
• How to get top categories based on sales
• How to extract top product names based on total profit
• How to identify branches with the highest cost
• How to calculate months with highest gross margin
• How to determine the least used payment method using COUNT
• How to find the most repeated grade
Whether you’re a beginner or intermediate Power BI learner, this video explains every step in a clear and simple manner without skipping any logic. By the end of the video, you will confidently create dynamic Top-N and Bottom-N measures for any dataset using Power BI DAX.
If you found this tutorial helpful, don’t forget to like, comment, and subscribe for more Power BI and data analytics content!
Chapters
00:00 Intro
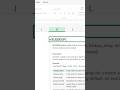
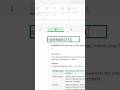
00:31 DAX
07:03 Outro
Download Dataset:
https://docs.google.com/spreadsheets/d/1H3AqP72JhF3DaqxrmV4-yhz7bdz6nx16/export?format=xlsx
power bi measure, dax tutorial, power bi profit per unit, power bi calculations, power bi beginners, power bi quick tips
Видео DAX for Data Analysts: Top Sellers, Lowest Performers, Profit Leaders in Power BI канала Pretty Pivots
This detailed walkthrough teaches you how to use SUM, COUNT, VAR, IF, RANK X, ALL, and other essential DAX functions to solve real-world business problems. We start with calculating simple aggregations, then move to assigning ranks, and finally apply conditions to extract insights like top performers, lowest performers, and most repeated values.
You will learn:
• How to calculate Totals using SUM
• How to assign ranks using RANK X with ALL
• How to return Top 1, Top 2, Top 5 values using IF and logical tests
• How to combine multiple calculations inside a single measure using VAR
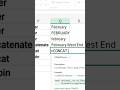
• How to find the month with the lowest quantity sold
• How to get top categories based on sales
• How to extract top product names based on total profit
• How to identify branches with the highest cost
• How to calculate months with highest gross margin
• How to determine the least used payment method using COUNT
• How to find the most repeated grade
Whether you’re a beginner or intermediate Power BI learner, this video explains every step in a clear and simple manner without skipping any logic. By the end of the video, you will confidently create dynamic Top-N and Bottom-N measures for any dataset using Power BI DAX.
If you found this tutorial helpful, don’t forget to like, comment, and subscribe for more Power BI and data analytics content!
Chapters
00:00 Intro
00:31 DAX
07:03 Outro
Download Dataset:
https://docs.google.com/spreadsheets/d/1H3AqP72JhF3DaqxrmV4-yhz7bdz6nx16/export?format=xlsx
power bi measure, dax tutorial, power bi profit per unit, power bi calculations, power bi beginners, power bi quick tips
Видео DAX for Data Analysts: Top Sellers, Lowest Performers, Profit Leaders in Power BI канала Pretty Pivots
Комментарии отсутствуют
Информация о видео
6 декабря 2025 г. 11:30:26
00:07:31
Другие видео канала