Python In Education: Advanced 2D Plots
This video describes a few advanced methods for making plots using Python and Matplotlib.
Here, I cover:
* points and lines on the same plot
* logarithmic plots (log-linear)
* error bars (both y and x error bars)
* bar graphs (including stacked bar graphs)
* colored background and grids
* changing the size of axis labels
* adding text and arrows to graphs
* multiple plots next to each other
* histograms (data and random numbers)
The best video to watch before you watch this video is this:
http://youtu.be/Wv-r-LNx5Eg
I have all of the Python scripts collected for you to download on Google Drive, which you can find here:
https://drive.google.com/?authuser=1#folders/0B-Hob7Evc6ImdDVUcDZEU05id1k
Видео Python In Education: Advanced 2D Plots канала New Planet School
Показать
Комментарии отсутствуют
Информация о видео
Другие видео канала
 DC Motor Basics
 Shorts: Ebola
 Making New Planet School Videos
 Mac Grapher: Differential Equations
 Python In Education: 2D Plots
 Mac Grapher: Animation
 Deliberate Practice: Quick Start Guide
 Calculus: Bisection, Secant, and Newton
 Trigonometry: Triangles
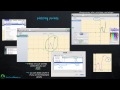 Mac Grapher: Basics
 Trigonometry: SOH-CAH-TOA
 Trigonometry: Sine, Cosine and Tangent
 Python In Education: Introduction
 Python In Education: Reading Files
 Calculus: What Is It?
 Mac Grapher: Customizing Graphs
 Mac Grapher: Integration
 Trigonometry: Unit Circle
 Shorts: Measuring Pi
 Deliberate Practice