How to Find and Use the Top Stock Technical Analysis Tool
🔴 Want to learn more, check out SteadyTrade Team: https://stockstotrade.info/3eObVeN
🔴 Try StocksToTrade for $7: https://stockstotrade.info/32Ijbqg
Trading without the proper technical analysis tools is like flying a plane without the instruments. You could do it … but it won’t be easy. Today, Tim Bohen discusses the smart way to simplify and maximize your trading journey. It all starts with using the right technical analysis tools.
🔴 Subscribe for more free Stock Trading tips: YouTube.com/StocksToTrade
👉Share this video with a fellow Trader: https://youtu.be/ihtu_CLQN5Y
✅ Links we mention and recommend:
🔴Try StocksToTrade for $7: https://stockstotrade.info/32Ijbqg
🔴Get our FREE weekly watchlist here: https://stockstotrade.info/3ePr8vZ
🔴Traders Blueprint Free Guide: https://stockstotrade.info/2WZjidp
✅ Recommended video: https://stockstotrade.info/2WIawQu
✅ Recommended playlists:
🔴SteadyTrade Podcast: http://bit.ly/2SXbrv7
🔴Stock Trading 101: A Day Trader's Guide: http://bit.ly/2sqs1ZZ
🔴Advanced Stock Trading Tips: http://bit.ly/3a32pTM
🔴Trader Spotlight with Tim Bohen: http://bit.ly/36TTzG3
🔴StocksToTrade Software Tips and Tricks: http://bit.ly/375GSry
🔴Weekly Trading Recap Videos: http://bit.ly/3a32uXA
🔴Charts and Patterns: http://bit.ly/2uj2KBO
✅ Follow StocksToTrade on social media:
Instagram: https://www.instagram.com/stockstotrade/
Facebook: https://www.facebook.com/StocksToTrade/
Twitter: https://twitter.com/StocksToTrade
Here’s one of the best things you can look for in technical analysis software…
Does it include access to all the tools you need?
As a day trader, you often make a lot of FAST decisions. And if you’re trying to do that and manage data and indicators from multiple software platforms, it can really slow you down and hurt your productivity.
That’s why we think StocksToTrade is so great! We’ve got everything all in one spot. (We know, we know … We’re biased, but we just can’t help it!)
When using technical analysis, we're talking about support, resistance, and key levels. Tune into the video to see how this can play out on the stock chart.
DPW was a great example of key levels, support and resistance, and breakout levels. You’ll see the stock spikes, pulls back, and then starts to base at the $3 level. The stock spikes up to $4, then pulls back and starts consolidating at $3.
You want to look for those key levels. That's how you use technical analysis to trade. Tune in as Bohen further explains this example and using key levels in your trading. From entry to confirmed breakout to risk management, it’s all in the charts. Study this!
Bonus: Bohen shows you how to customize screeners on StocksToTrade.
#StockMarket #TradingTools #TechnicalAnalysis
----------------------------------------------------------------------------------------------------------------
*Tim Bohen teaches skills others have used to make money. Most who receive free or paid content will make little or no money because they will not apply the skills being taught. Any results displayed may be exceptional. We do not guarantee any outcome regarding your earnings or income as the factors that impact such results are numerous and uncontrollable.
You can lose money trading stocks. Do not invest money you cannot afford to lose. You understand and agree you will consider the important risk factors in deciding to purchase any of our products or services.
Видео How to Find and Use the Top Stock Technical Analysis Tool канала StocksToTrade
Показать
Комментарии отсутствуют
Информация о видео
Другие видео канала
 The Dip and Rip Is a Top Trading Pattern for 2020: Learn This Now!
 Swing Trading 101, Episode 1: How to Swing Trade With a Busy Schedule
 Ep 95: Does Technical Analysis Work When Trading Stocks & Why?
 TWIST: Dom's Resurrection, OTSwizzle™ & Technical Analysis with $NWBO
 How to Research a Stock using Yahoo Finance
 6 Tips for Trading the VWAP Hold High-of-Day Pattern
 Best ThinkorSwim Indicators || Relative Strength/Weakness
 Best Trend Lines Trading Strategy (Advanced)
 The Short Squeeze: How to Ride the Momentum
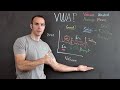 Why I Started Using This Day Trading Indicator (the best!)
 My Winning Stock Screener Using IBD
 Ross makes +$73k 🥳 in 2hrs Day Trading Momentum on $MIST +174%
 The 4 Most Important Financial Metrics
 Amazingly Simple Price Action Scalping Trading Strategy || 15 Minute Scalping || Trade like a Pro
 Basic tour and breakdown of Oracle, our watch list building and trading algorithm.
 Best Chart Analysis I've Seen In 10 Years...
 How to Navigate and Survive a Bear Market | The Tuohey Talk Show: Episode 12
 How to Read Level 2 Time and Sales, Tape Reading - Day Trading for Beginners 2022
 Don't Miss These OTC Plays!
 Learn the ABCs of the ABCD Chart Pattern