- Популярные видео
- Авто
- Видео-блоги
- ДТП, аварии
- Для маленьких
- Еда, напитки
- Животные
- Закон и право
- Знаменитости
- Игры
- Искусство
- Комедии
- Красота, мода
- Кулинария, рецепты
- Люди
- Мото
- Музыка
- Мультфильмы
- Наука, технологии
- Новости
- Образование
- Политика
- Праздники
- Приколы
- Природа
- Происшествия
- Путешествия
- Развлечения
- Ржач
- Семья
- Сериалы
- Спорт
- Стиль жизни
- ТВ передачи
- Танцы
- Технологии
- Товары
- Ужасы
- Фильмы
- Шоу-бизнес
- Юмор
BEARISH RECTANGLE PATTERN: #stockmarket #trading #money #investing #business
FOLLOW US ON :
Instagram: https://www.instagram.com/wiseeducationz
Facebook: https://www.facebook.com/share/1Aeswy1Qmu/
WEBSITE: https://wisetradezone.com/
EMAIL: uddipwiseinvesting@gmail.com
TELEGRAM CHANNEL:
https://t.me/WISEEDUCATIONZ
TO JOIN OUR INSTITUTE:
CALL ON: 09998578565
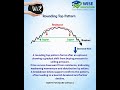
A bearish rectangle pattern is a continuation pattern in technical analysis that signals a possible continuation of a downtrend after a period of consolidation. It forms when the price moves within a horizontal range, creating a “rectangle” shape on the chart before eventually breaking downward.
This pattern appears during a downtrend when sellers temporarily pause, and buyers try to push prices up, but fail to create higher highs. As a result, the price oscillates between a clear support level and a resistance level. The upper boundary acts as resistance where selling pressure increases, while the lower boundary acts as support where buying interest appears. However, this buying strength is usually weak.
The key characteristic of a bearish rectangle is that the highs and lows remain relatively equal, forming parallel horizontal lines. Volume often decreases during the consolidation phase, indicating indecision in the market. This phase reflects a balance between buyers and sellers, but the prior trend (downtrend) suggests that sellers still have control.
A breakout occurs when the price falls below the support level with increased volume. This breakdown confirms the pattern and signals that sellers have regained dominance. Traders often enter short positions at this point, expecting further downward movement.
The target price for a bearish rectangle is typically calculated by measuring the height of the rectangle and projecting it downward from the breakout point. Stop-loss orders are usually placed just above the resistance level to manage risk.
In summary, the bearish rectangle pattern represents a pause in a downtrend before continuation. It helps traders identify potential selling opportunities and manage trades effectively by using clear support and resistance levels.
TO JOIN OUR ONLINE CLASS
WHATSAPP ON : 09157665332
THE SMART TRADERS PLAY BOOK
AVAILABE ON:
AMAZON:
https://www.amazon.in/Smart-Traders-Play-Book-Strategies/dp/9373104985
FLIPKART:
https://www.flipkart.com/smart-traders-play-book-proven-strategies-win-any-market/p/itm3a339fc1f2732
GOOGLE BOOKS:
https://books.google.co.in/books/about/The_Smart_Traders_Play_Book_Proven_Strat.html?id=6uSPEQAAQBAJ&redir_esc=y
Видео BEARISH RECTANGLE PATTERN: #stockmarket #trading #money #investing #business канала Wise Education by Hemant sir
Instagram: https://www.instagram.com/wiseeducationz
Facebook: https://www.facebook.com/share/1Aeswy1Qmu/
WEBSITE: https://wisetradezone.com/
EMAIL: uddipwiseinvesting@gmail.com
TELEGRAM CHANNEL:
https://t.me/WISEEDUCATIONZ
TO JOIN OUR INSTITUTE:
CALL ON: 09998578565
A bearish rectangle pattern is a continuation pattern in technical analysis that signals a possible continuation of a downtrend after a period of consolidation. It forms when the price moves within a horizontal range, creating a “rectangle” shape on the chart before eventually breaking downward.
This pattern appears during a downtrend when sellers temporarily pause, and buyers try to push prices up, but fail to create higher highs. As a result, the price oscillates between a clear support level and a resistance level. The upper boundary acts as resistance where selling pressure increases, while the lower boundary acts as support where buying interest appears. However, this buying strength is usually weak.
The key characteristic of a bearish rectangle is that the highs and lows remain relatively equal, forming parallel horizontal lines. Volume often decreases during the consolidation phase, indicating indecision in the market. This phase reflects a balance between buyers and sellers, but the prior trend (downtrend) suggests that sellers still have control.
A breakout occurs when the price falls below the support level with increased volume. This breakdown confirms the pattern and signals that sellers have regained dominance. Traders often enter short positions at this point, expecting further downward movement.
The target price for a bearish rectangle is typically calculated by measuring the height of the rectangle and projecting it downward from the breakout point. Stop-loss orders are usually placed just above the resistance level to manage risk.
In summary, the bearish rectangle pattern represents a pause in a downtrend before continuation. It helps traders identify potential selling opportunities and manage trades effectively by using clear support and resistance levels.
TO JOIN OUR ONLINE CLASS
WHATSAPP ON : 09157665332
THE SMART TRADERS PLAY BOOK
AVAILABE ON:
AMAZON:
https://www.amazon.in/Smart-Traders-Play-Book-Strategies/dp/9373104985
FLIPKART:
https://www.flipkart.com/smart-traders-play-book-proven-strategies-win-any-market/p/itm3a339fc1f2732
GOOGLE BOOKS:
https://books.google.co.in/books/about/The_Smart_Traders_Play_Book_Proven_Strat.html?id=6uSPEQAAQBAJ&redir_esc=y
Видео BEARISH RECTANGLE PATTERN: #stockmarket #trading #money #investing #business канала Wise Education by Hemant sir
Комментарии отсутствуют
Информация о видео
5 мая 2026 г. 16:01:29
00:00:36
Другие видео канала