- Популярные видео
- Авто
- Видео-блоги
- ДТП, аварии
- Для маленьких
- Еда, напитки
- Животные
- Закон и право
- Знаменитости
- Игры
- Искусство
- Комедии
- Красота, мода
- Кулинария, рецепты
- Люди
- Мото
- Музыка
- Мультфильмы
- Наука, технологии
- Новости
- Образование
- Политика
- Праздники
- Приколы
- Природа
- Происшествия
- Путешествия
- Развлечения
- Ржач
- Семья
- Сериалы
- Спорт
- Стиль жизни
- ТВ передачи
- Танцы
- Технологии
- Товары
- Ужасы
- Фильмы
- Шоу-бизнес
- Юмор
PCA Part 1: Explained with a Flashlight and Marbles 🔦
What is PCA actually doing to your data? This video explains it with one physical analogy: shining a flashlight at a handful of marbles and looking at the shadow on the wall. PCA finds the single best flashlight angle — the one where the shadows spread out the most. That spread is the information you keep.
What you'll learn:
→ Why PCA is just finding the best "angle" to look at your data
→ What PC1 and PC2 actually mean — no linear algebra required
→ Why the wrong angle destroys information and the right angle preserves it
→ How to go from 50 measurements per patient to a 2D scatter plot
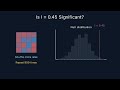
→ What "variance explained" really means
No equations. Just marbles and shadows.
📌 Timestamps
0:00 — The problem: 50 dimensions
0:18 — The flashlight analogy
0:42 — Finding PC1: the angle of maximum spread
1:10 — PC2 and the scree plot
1:38 — Real data: from 50 genes to 2D
2:02 — One-line summary
PCA Part 2 Link - Loadings, Scree Plots & Real Biology Data: https://youtu.be/50IHyfI7ejw
Видео PCA Part 1: Explained with a Flashlight and Marbles 🔦 канала QSPplus
What you'll learn:
→ Why PCA is just finding the best "angle" to look at your data
→ What PC1 and PC2 actually mean — no linear algebra required
→ Why the wrong angle destroys information and the right angle preserves it
→ How to go from 50 measurements per patient to a 2D scatter plot
→ What "variance explained" really means
No equations. Just marbles and shadows.
📌 Timestamps
0:00 — The problem: 50 dimensions
0:18 — The flashlight analogy
0:42 — Finding PC1: the angle of maximum spread
1:10 — PC2 and the scree plot
1:38 — Real data: from 50 genes to 2D
2:02 — One-line summary
PCA Part 2 Link - Loadings, Scree Plots & Real Biology Data: https://youtu.be/50IHyfI7ejw
Видео PCA Part 1: Explained with a Flashlight and Marbles 🔦 канала QSPplus
PCA explained principal component analysis PCA tutorial dimensionality reduction PCA for beginners PCA biology PCA scatter plot principal components variance explained scree plot bioinformatics PCA RNA seq PCA PCA intuition what is PCA dimensionality reduction biology QSPplus principal componant analysis
Комментарии отсутствуют
Информация о видео
21 апреля 2026 г. 23:44:51
00:03:22
Другие видео канала