Power Query Power BI: Transform 2 Fact Tables to Star Schema Data Model (Invoice Data) EMT 1498
Download File: Source Data Tables : https://people.highline.edu/mgirvin/YouTubeExcelIsFun/EMT1498-SourceModel.xlsx Finished Power BI File: https://people.highline.edu/mgirvin/YouTubeExcelIsFun/EMT-1498-PowerBIDesktopPowerQuery.pbix
Entire page with all Excel Files for All Videos: http://people.highline.edu/mgirvin/excelisfun.htm
In this video learn how to Transform Two Fact Tables (Header Invoice and Invoice Line Item Tables) with Dimension Tables into a Proper Star Schema using Power Query inside Power BI Desktop. The Power Query Steps can be used in Excel or Power BI. Learn how to use Power Query to Import non-Start-Schema Model, Transform the tables using Custom Columns & Merges and other steps to then load a Star Schema Model into Power BI Data Model.
Video Steps:
1. (00:06) Introduction including why we need Star Schema
2. (04:21) Import Two Fact Table Data Model in Power BI Desktop using Power Query
3. (05:42) Multiply Columns using Multiply feature to calculate “Line Sales”
4. (06:39) Merge to lookup Product Weight
5. (07:13) Multiply Columns using Multiply feature to calculate “Line Weight”
6. (07:30) Group By to aggregate Line Sales and Line Weight in order to get Invoice / Header Level Amounts, but we also Group By Rows to save the Line Item Level data so we can use it later in the query
7. (09:24) Merge to lookup Invoice Level Shipping and Discount Amounts
8. (10:40) Divide Columns using Divide feature to calculate “Invoice % Discount”
9. (12:00) Expand Group By Rows step from earlier in query to get line item detail
10. (12:55) Add Data Formatting to Expanded Columns
11. (14:00) Multiply Columns using Multiply feature to calculate “Line Discount”
12. (14:38) Create Custom Column to calculate “Line Shipping Costs”
13. (16:14) Edit the previous two columns by editing the Table.AddColumn function and add the Power Query Function Number.Round
14. (17:13) Remove Columns that are not part of the final single Fact Table.
15. (18:00) Hide Fact Table we do not need so it is not imported into Data Model, but instead only used in the Power Query Transformation using the “Enable Load” check box option in the list of queries on the left side of the Power Query Window (Right-click option).
16. (18:23) Close and Apply to Load Star Schema Data Model into the Power BI Desktop Data Model.
17. (18:31) Create Relationships between Single Line Item Fact table and the three Dimension Tables.
18. (19:00) Create five Measures: Total Sales, Total Shipping, Total Discount, Shipping as % of Sales, Discount as % of Sales.
19. (21:01) Hide Columns we don’t need in Report View (Hide in Report View)
20. (22:06) Create Visualization that contains the Measures and a Slicer from Each Dimension Table
21. (25:12) Summary
Search terms in this video: Header Detail Granularity Reporting Problem, Invoice Level, Invoice Detail Level Mismatch, Invoice Granularity Mismatch Reporting Issue, Invoice Total / Invoice Detail, Allocating Invoice Totals to Invoice Detail Level, Header/Line Item Transactions, Header / Line Item Transactions Reporting Issues, Two Fact Tables, Different Granularity, Two Transaction Tables, Different Granularity, Star Schema, Transform Two Fact Tables to Star Schema
Excel Magic Trick 1498
Видео Power Query Power BI: Transform 2 Fact Tables to Star Schema Data Model (Invoice Data) EMT 1498 канала ExcelIsFun
Показать
Комментарии отсутствуют
Информация о видео
Другие видео канала
 Handling MULTIPLE fact tables in Power BI
 Power BI Tutorial | From Flat File To Data Model
 MSPTDA 23: Two Fact Tables? DAX, Power Query or Worksheet Formulas to Convert to 1 Fact Table
 Building relationships between tables when both have duplicates
 Data Modelling: From Single Table To Star Schema - Chris Barber
 Power Query Running Count Based on Row Condition – Excel Magic Trick 1588
 Star and Snowflake schema explained with real scenarios
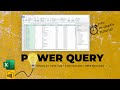 Power Query Tutorial - What is it, how to use it & 4 complete examples + Free download
 Comparative Analysis Dashboard in Power BI | Step by Step Design, Data Model, DAX and Publish
 Microsoft Power BI: The Do’s and Don’ts of Power BI Relationships - BRK3019
 RLS with TWO Fact tables in Power BI
 9 things to know before getting into Power BI (Or, really anything)
 Data Modeling (Star Schema 🌟) in Power BI – Creating Dimension Tables
 Excel PRO TIP: Data Modeling 101 | Udemy Instructor, Chris Dutton
 How To Break Out Large Tables Into Multiple Tables And Build A Model - Power BI Tips
 Fact & Dimension tables in Power BI | Data Modelling
 Power BI Data Modelling Tutorial 1 - Star Schema?
 How To Manage Multiple Date Calculations In Your Fact Tables - Advanced Power BI
 Creating The Ultimate Date Table In Power BI - How To Do This Fast (Updated Code)