Interpreting Multiple Regression Output for Business Statistics
Building on our regression model, we add more predictors and interpret the output to see how they improve the model. We begin by checking the assumptions for multiple regression – outliers, normality, homoscedasticity, independence of observations, and multicollinearity – using the output and checks like standardized residuals, Q-Q plot, Durbin-Watson, tolerance, and VIF. Then we add two more predictor to our original model and watch how the parameters change and whether the r-squared change justifies keeping them.
This lecture was recorded on Monday, November 2, 2020 at Missouri State University for QBA 337 – Applied Business Statistics
Music
50 Ways to Clean Your Data – The Spurious Correlations, from the unreleased album of statistical parodies Dark Side of the Mu
Link to a Google Drive folder with any files that I use in the videos. As I add new files, they will appear here, as well.
https://drive.google.com/drive/folders/1n9aCsq5j4dQ6m_sv62ohDI69aol3rW6Q?usp=sharing
To download, hover your cursor over the file icon and a blue download icon will appear. You do not need to request access to a file.
Видео Interpreting Multiple Regression Output for Business Statistics канала Research By Design
Показать
Комментарии отсутствуют
Информация о видео
Другие видео канала
 How to do Simple Linear Regression in SPSS (14-5)
 Multiple linear regression - explained with two simple examples
 Regression Output Explained
 Regression Analysis | Full Course
 Multiple Linear Regression in SPSS with Assumption Testing
 Ideal SPSS 27 Workflow for Research and Analysis - Statistics for Beginners (with Puppies) (8 of 8)
 01 How to Use SPSS - An Introduction to SPSS for Beginners
 "Regression Introduction & Formulas" In Statistics By Dr.Devika Bhatnagar
 Factor Analysis | What is Factor Analysis? | Factor Analysis Explained | Machine Learning | Edureka
 Multivariate Analysis of Variance | MANOVA | SPSS
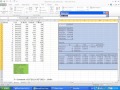 Using Multiple Regression in Excel for Predictive Analysis
 SPSS for Beginners 6: Regression
 Linear Regression Summary in R
 Statistics 101: Linear Regression, The Very Basics 📈
 How to Use SPSS: Standard Multiple Regression
 Interpreting Output for Multiple Regression in SPSS
 Introduction to Statistics
 Understanding zero order, partial, and part correlations in your SPSS regression output (July 2020)
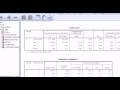 SPSS for newbies: Watch out for multicollinearity in multiple regression