Bitcoin On-Chain Analysis: HODL Waves
Occasionally we must put on our on-chain analysis hat and discuss metrics such as HODL waves for #Bitcoin. These are useful for identifying trends in long-term and short-term holders.
Reading from the bottom of the chart up, the red colored bands show the percent of supply that has been active relatively recently, ranging from less than a day to 90-180 days. The “1-7 Days” band is the percent of total supply that's been held for at least 1 day but less than 7 days, “7-30 Days” is the percent of supply that's been held for at least 7 days but less than 30 days, and so on. Conversely, reading from the top of the chart down shows the supply that has not moved for relatively long periods. These long-term bands tend to grow wider as prices reach cycle lows and contract during cycle tops as long-terms holders begin to sell.
Into The Cryptoverse Premium:
https://intothecryptoverse.com
Data provided by https://coinmetrics.io/
LIFETIME OPTION:
https://intothecryptoverse.com/product/subscription-to-the-premium-list-lifetime/
Alternative Option:
https://www.patreon.com/intothecryptoverse
Merch:
https://store.intothecryptoverse.com/
Disclaimer: The information presented within this video is NOT financial advice.
Telegram: https://t.me/intocryptoverse
Twitter: https://twitter.com/intocryptoverse
TikTok: tiktok.com/@benjamincowencrypto
Instagram: https://www.instagram.com/bjcowen/
Discord: https://discord.gg/UGwc6eR
Facebook: https://www.facebook.com/groups/intothecryptoverse
Reddit: https://www.reddit.com/r/intothecryptoverse/
Website: https://intothecryptoverse.com/
Видео Bitcoin On-Chain Analysis: HODL Waves канала Benjamin Cowen
Показать
Комментарии отсутствуют
Информация о видео
Другие видео канала
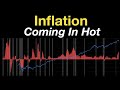 Inflation Coming In Hot
 Bitcoin LIVE SHOW!
 Bitcoin: The Test Continues
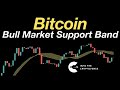 Bitcoin Bull Market Support Band Update
 Bitcoin: Watch The Weekly Close
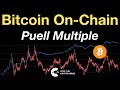 Bitcoin On-Chain Analysis: Puell Multiple
 Bitcoin Bull Market Support Band
 Bitcoin: Stock-To-Flow Model
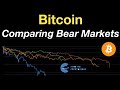 Bitcoin: Comparing The Bear Markets
 Bitcoin: Key Milestones
 Bitcoin: Logarithmic Regression
 Bitcoin: Accounting for the Money Supply
 S&P500: Accounting for the Money Supply
 Bitcoin: Hold The Line!
 Bitcoin: Through A Different Lens
 Bitcoin Bull Market Support Band (LIVE!)
 Bitcoin: Whale Watching
 Bitcoin: Heikin-Ashi Candles
 Bitcoin: Whale Games
 Bitcoin: Accounting for the Money Supply
 Bitcoin: The Beauty Of Mathematics (Part 23)