Google Data Studio Complete Tutorial for Beginners 🔥
Learn how to create a visually insightful dashboard in an hour with Google Data Studio. You will be able to do this free with a great dataset and showcase this project in your data analysis portfolio. In this 1 hour video you will learn how to load, blend , use functions and visualize data with ease.
#dashboard
#googledatastudio
#datavisualization
LOADING DATA
2:45 Loading in data
6:50 Report Window and Interface
10:00 Building your Visual
CALCUALTED FEILDS & FUNCTIONS
11:40 Adding Calculated Fields
15:48 Visualization Objectives
16:45 Using Functions
25:50 Pivot Tables and Sorting
BLENDING DATA & MAPS
31:40 Adding and Blending Data
34:33 Join Types
39:30 Null Values
43:00 CONTROLS AND FILTERS
43:49 Date Controls
45:42 Comparing Dates
47:15 Drop Down Filter
52:50 Maps
VISUALIZING AND STYLING
56:00 Report Style and theme
Check me out on Linkedin
https://www.linkedin.com/in/gaelimholland
Get the files here
https://github.com/Gaelim/google-data-stuido
or
You can access them here if you are not famiiar with Github:
https://absentdata.com/data-analysis/where-to-find-data/
Get access to the dashboard.
https://datastudio.google.com/s/sHRc1R6WfuI
Видео Google Data Studio Complete Tutorial for Beginners 🔥 канала Absent Data
Показать
Комментарии отсутствуют
Информация о видео
Другие видео канала
 SQL Pivot Table | SQL For Data Analysts
 Clean Address Data with Pandas | Python for Data Analysts
 Python Data Query | Python for Data Analyst
 Change Functions | Python for Data Analysts
 Excel to Python & Python to Excel
 Forecasting with Facebook Prophet Time Series Model
 Find the N-Largest and N-Smallest Values | Python for Data Analysts
 Handling Missing Values | Python for Data Analysts
 Pattern Matching | Python STR Methods | Python for Data Analyst
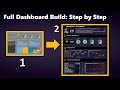 Step by Step Power BI Dashboard Build -- Part 2 of End-to-End Project
 Python for Data Analysts | MERGE datasets | Inner, Right, Left, Outer Joins
 Data Analysis SQL Interview | UNION | Compare Postive Rating Percenage
 Data Analysis SQL Interview Questions | Running SUM | Who Hit the Sales Target First
 Data Analyst SQL Interview Questions | CONCAT function
 Find Outliers in SQL | Data Analyst SQL Interview Question
 Extract ZIP Codes | String Contains Substring | Data Analyst SQL Interview Questions
 Data Analyst SQL Interview Question | PERCENTILE Function | Top 1% of Salaries
 Create Column Sparklines in Excel for Quick Trend Insights! #excel #dataanalysis
 Data Analyst SQL Interview Questions | RANK, DENSE RANK, ROW NUMBER | #sql
 Data Analyst SQL Interview Question | LAG Function | Previous Day Comparison #dataanalysis #sql
 Data Analyst SQL Interview Question |Self-Joins Explained #dataanalysis #sql #sqlinterview