Graph Everything! by Kunal Kerkar | PyCon SG 2013
https://pycon.sg/ PyCon SG 2013
Graph Everything! by Kunal Kerkar
Description
At Plivo, its all about graphing data. If its in text and numbers, it needs to be on a graph. This talk would focus on collecting data, analyzing it and finally putting it on swanky graphs!
Abstract
The chaos phase!
This is the first phase of data coming out of tools like iostat, procfile and disk monitoring tools. All this data is received by a daemon who is constantly listening in.
We have normalized data
Now that data has reached our daemon, we process it and send it over to RRDtool which is a high performance data logging and graphing system for time series data.
Graph it
Once we have the data, we use rickshaw to graph it.
PyCon SG 2013
https://pycon.sg/
Python User Group Singapore
Видео Graph Everything! by Kunal Kerkar | PyCon SG 2013 канала pycon apac
Показать
Комментарии отсутствуют
Информация о видео
Другие видео канала
 High Speed Data Shredding using Python - David Leong, Eugene Yeo
 Permission or Forgiveness - Alex Martelli
 MongoDB with Python - Mathias Stearn
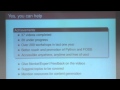 FOSSEE : Pythonizing the Indian Engineering Education - Primal Pappachan, Parth Buch
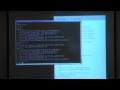 An Introduction to Debugging with pdb - Aurelien Collard
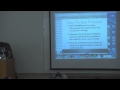 create_awesome_api(time_limit='1 week') by Nishad Musthafa | PyCon SG 2013
 Relational Database Access with Python sans ORM - Mark Rees
 Startup Booth & Lightning Talks 1 | PyCon SG 2013
 Startup Booth & Lightning Talks 2 | PyCon SG 2013
 Is PyPy Ready For Production? by Mark Rees | PyCon SG 2013
 Using Google App Engine to Back Web Applications - Owen Jones
 'FUSE'ing Python for Rapid Development of Storage Efficient File-System
 Diversity as a Dependency - Anna Martelli Ravenscroft
 Real-time Apps with GEVENT-SOCKETIO by Calvin Cheng | PyCon SG 2013
 Application of Python in Google App Engine for Transportation Partnership - Edmund Chan
 Maps of Imaginary Lands - Malcolm Tredinnick
 PyCon SG 2013 Conference Keynote from Wes McKinney
 Python as a Scientist by Markus Baden | PyCon SG 2013
 Test Driven Development for Small Django Projects - Martin Brochhaus
 The Pikos Profiling Toolkit - Simon Jagoe