Chart Professor: Point and Figure Charts Ignore the Noise
The Chart Professor is back so we can dive further into the stock charts you need to understand and analyze to make smart investment decisions.
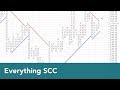
This week Bruce Kamich, our resident Chart Professor and in-house technical analyst, helps us really understand the point and figure chart. It's one of the oldest charts in U.S. and dates back to 1880's. A mark only is made on this chart when the stock moves a predetermined price. In the chart in this video, each "X" represents a move up. A "0" notes a reaction to the move.
And while it looks like you charting out football plays, it's worth taking the time to really understand it -- because too many investors don't.
Here are the pros and cons, per Kamich:
Pros
Just focuses on price changes - ignores "noise," volume and time
Breakouts and breakdowns are clearer
Adaptable
Can give longer-term price targets
Cons
Not popular
Conceptually hard to understand at first
So watch the video above now to learn more and be sure to reach out to either of us if you have any questions or want us to cover something special @ tracybyrnes @ brucekamich.
You can also find us on...
SUBSCRIBE | http://t.st/TheStreetTV
FACEBOOK | https://www.facebook.com/TheStreet/
TWITTER | http://twitter.com/thestreet
PODCASTS | https://soundcloud.com/thestreetlive
THESTREET.COM | https://www.thestreet.com/
LINKEDIN | http://linkedin.com/company/theStreet
INSTAGRAM | https://www.instagram.com/thestreet/?hl=en
Sign up for ActionAlertsPlus.com today for exclusive insight into Jim Cramer’s charitable portfolio: https://buff.ly/2mfp4Vy
Видео Chart Professor: Point and Figure Charts Ignore the Noise канала TheStreet: Investing Strategies
Показать
Комментарии отсутствуют
Информация о видео
26 июня 2018 г. 21:27:13
00:04:19
Другие видео канала
 Point and Figure Charts | Chip Anderson
 Two Legends | Together
 Gonçalo Moreira, CMT: Point and Figure Basics
 Wyckoff Point & Figure Tutorial - Part 2
 How I use Point and Figure charts to trade easy setups on the EURUSD pair
 Wyckoff Point and Figure Tutorial: Part One | Bruce Fraser
 Wyckoff Point & Figure Tutorial - Part 1
 Point and Figure Basics - Sectors Made Simple Free Webinar
 How to use Point and Figure Charts (Point and Figure Charting Tutorial)
 Using Point & Figure to Find Option Trades
 P&F Charting! | Deep Dive | Chip Anderson
 Benefits of noiseless charts Renko & Point & Figure | Prashant Shah, CMT chats with Alok Bramhe, CMT
 How to Analyze and Trade Stocks Using a Point and Figure Chart #pointandfigure
 Pairs Trading | How to Do Futures
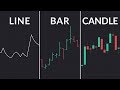 What is the Best Chart Type?
 Point and Figure Stock Charts Explained Simply. // p&f chart tutorial basics trading strategy video
 Gonçalo Moreira, CMT: Point and Figure Charting: The 1 - Box Chart
 Understanding Point & Figure Chart and How to Trade with it? | Edelweiss Wealth Management
 Point and Figure and Noiseless Charts