- Популярные видео
- Авто
- Видео-блоги
- ДТП, аварии
- Для маленьких
- Еда, напитки
- Животные
- Закон и право
- Знаменитости
- Игры
- Искусство
- Комедии
- Красота, мода
- Кулинария, рецепты
- Люди
- Мото
- Музыка
- Мультфильмы
- Наука, технологии
- Новости
- Образование
- Политика
- Праздники
- Приколы
- Природа
- Происшествия
- Путешествия
- Развлечения
- Ржач
- Семья
- Сериалы
- Спорт
- Стиль жизни
- ТВ передачи
- Танцы
- Технологии
- Товары
- Ужасы
- Фильмы
- Шоу-бизнес
- Юмор
Building a COVID-19 Data Tracker with API Integration and Time-Series Visualization in Python
Learn how to get started with data mining using real world COVID-19 and Titanic data sets. This tutorial covers loading, exploring, cleaning, and visualizing public data with Python, focusing on practical steps for beginners. You will practice time series analysis, handle missing values, and create clear charts to reveal trends and patterns.
Follow along as we reshape COVID-19 case data for time-based analysis, compare trends between countries, and explore the famous Titanic data set for predictive modeling. By the end, you will understand essential data mining workflows and be ready to apply these skills to your own projects.
00:00 Introduction to Data Mining with Real World Data
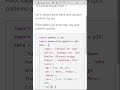
01:13 Setting Up the Python Environment
02:24 Loading COVID-19 Global Case Data
03:32 Exploring the COVID-19 Dataset Structure
04:51 Checking Columns and Missing Values
05:51 Cleaning and Inspecting Country Names
07:16 Reshaping Data for Time Series Analysis
08:22 Plotting Total Cases for One Country
10:13 Interactive Country Plotting
11:38 Monthly New Cases Visualization
13:25 Comparing Two Countries in 2020
14:54 Exporting Cleaned Data for Future Use
15:41 Introducing the Titanic Data Set
16:12 Loading and Previewing Titanic Data
17:23 Handling Missing Values in Titanic Data
18:20 Recap and Key Takeaways
19:02 Next Steps and Practice Suggestions
19:24 YouTube Call to Action
#DataMining #PythonTutorial #DataAnalysis
Видео Building a COVID-19 Data Tracker with API Integration and Time-Series Visualization in Python канала Mathew K Analytics
Follow along as we reshape COVID-19 case data for time-based analysis, compare trends between countries, and explore the famous Titanic data set for predictive modeling. By the end, you will understand essential data mining workflows and be ready to apply these skills to your own projects.
00:00 Introduction to Data Mining with Real World Data
01:13 Setting Up the Python Environment
02:24 Loading COVID-19 Global Case Data
03:32 Exploring the COVID-19 Dataset Structure
04:51 Checking Columns and Missing Values
05:51 Cleaning and Inspecting Country Names
07:16 Reshaping Data for Time Series Analysis
08:22 Plotting Total Cases for One Country
10:13 Interactive Country Plotting
11:38 Monthly New Cases Visualization
13:25 Comparing Two Countries in 2020
14:54 Exporting Cleaned Data for Future Use
15:41 Introducing the Titanic Data Set
16:12 Loading and Previewing Titanic Data
17:23 Handling Missing Values in Titanic Data
18:20 Recap and Key Takeaways
19:02 Next Steps and Practice Suggestions
19:24 YouTube Call to Action
#DataMining #PythonTutorial #DataAnalysis
Видео Building a COVID-19 Data Tracker with API Integration and Time-Series Visualization in Python канала Mathew K Analytics
Комментарии отсутствуют
Информация о видео
30 сентября 2025 г. 7:33:58
00:19:36
Другие видео канала