- Популярные видео
- Авто
- Видео-блоги
- ДТП, аварии
- Для маленьких
- Еда, напитки
- Животные
- Закон и право
- Знаменитости
- Игры
- Искусство
- Комедии
- Красота, мода
- Кулинария, рецепты
- Люди
- Мото
- Музыка
- Мультфильмы
- Наука, технологии
- Новости
- Образование
- Политика
- Праздники
- Приколы
- Природа
- Происшествия
- Путешествия
- Развлечения
- Ржач
- Семья
- Сериалы
- Спорт
- Стиль жизни
- ТВ передачи
- Танцы
- Технологии
- Товары
- Ужасы
- Фильмы
- Шоу-бизнес
- Юмор
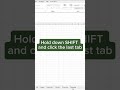
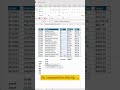
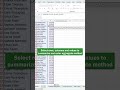
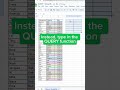
How to Create Interactive Dashboard in Excel
In this video, you’ll learn how to create interactive Excel dashboards that update automatically using Excel slicers and interactive charts.
Interactive dashboards in Excel allow you to analyze data in real time, track performance, and make better business decisions with the most up-to-date information at your fingertips.
You’ll learn how to:
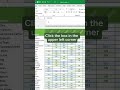
Create interactive Excel dashboards
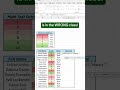
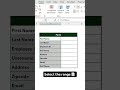
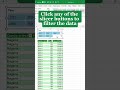
Use Excel slicers to filter and visualize data
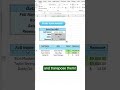
Connect slicers to charts and tables
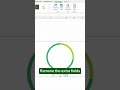
Format charts to work seamlessly with slicers
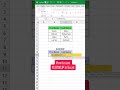
Build automatically updating charts for reports and dashboards
Excel slicers are a powerful tool for data visualization, business intelligence, and reporting, making your dashboards interactive, clean, and professional.
This tutorial is perfect for Excel beginners, data analysts, business analysts, and professionals looking to build powerful Excel dashboards.
📊 Learn Excel & analytics the practical way with BecomingAnAnalyst
🚀 New Excel and dashboard tutorials weekly
#excel #exceldashboard #excelslicers #datavisualization #businessintelligence #dataanalysis #exceltutorial #exceltraining #becomingananalyst
Видео How to Create Interactive Dashboard in Excel канала Becoming An Analyst
Interactive dashboards in Excel allow you to analyze data in real time, track performance, and make better business decisions with the most up-to-date information at your fingertips.
You’ll learn how to:
Create interactive Excel dashboards
Use Excel slicers to filter and visualize data
Connect slicers to charts and tables
Format charts to work seamlessly with slicers
Build automatically updating charts for reports and dashboards
Excel slicers are a powerful tool for data visualization, business intelligence, and reporting, making your dashboards interactive, clean, and professional.
This tutorial is perfect for Excel beginners, data analysts, business analysts, and professionals looking to build powerful Excel dashboards.
📊 Learn Excel & analytics the practical way with BecomingAnAnalyst
🚀 New Excel and dashboard tutorials weekly
#excel #exceldashboard #excelslicers #datavisualization #businessintelligence #dataanalysis #exceltutorial #exceltraining #becomingananalyst
Видео How to Create Interactive Dashboard in Excel канала Becoming An Analyst
Комментарии отсутствуют
Информация о видео
14 февраля 2026 г. 14:30:22
00:02:13
Другие видео канала