How to use Trend Lines and Channels to Trade! 📈
Using Trend lines and Channels. http://www.financial-spread-betting.com/course/trendlines.html PLEASE LIKE AND SHARE THIS VIDEO SO WE CAN DO MORE! Spotting trend and Channels.
There’s another way that you can include lines on your charts to help you figure out when to trade. You know about support and resistance levels, and these are represented by horizontal lines positioned at price turning points or reversals. But you can also use lines that slope in the direction of the market, and these are called trend lines.
When you have a trend, whether an uptrend or a downtrend, support and resistance levels are of marginal use. In an uptrend, you may find a resistance level is broken by the price going up then the price will retrace back down to the same level and find support before resuming a trend – but that’s about it. On the other hand, trend lines are sloped either up or down, depending on the trend, and may provide support/resistance many times during the trend.
Taking an uptrend for the first example, a trend line may be drawn sloping upwards, and connecting (roughly) the lowest price points touched as the price increases. As you can see from any chart, the price will never go up in a straight line but will always go up and down a little as it creeps up. The trend line connects those low points.
Finding and drawing a trend line is very subjective, and may not always be possible. But often you can draw a straight line that more or less connects several points, and provided the trend continues you will often find that this gives support every time the price comes back down. It’s worth looking at a few charts and practising so that you can see how this works.
Traders also draw what is called a channel. This is a sloping line drawn parallel to the trend line, but slid up to be over the top of the prices. Again, we are looking to connect many peaks of the price chart. Then with a well behaved price, you will find it oscillates in the channel formed by the two lines as it generally increases.
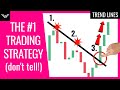
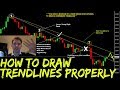
With a downtrend, the trend line is usually drawn first, sloping downward and connecting the successively lower price peaks, that is on top of all the price movements. Then the channel line can be drawn underneath the reducing prices. Again the principle is that the price will tend to remain between the two lines in the channel so formed.
You will find that some charts behave better than others when you’re trying to locate trend lines and channel lines. It won’t always be possible to draw straight lines connecting the points, but if you can it is a useful tool to help in your trading. Try not to be too accurate, but to look at the overall picture and figure out a commonsense solution.
Finally, just as you can see price movements gathering at the channel lines and being rebuffed, you may also see some price hesitation when the price passes over the middle between the two channel lines. Although it’s not strictly drawn as part of the channel, many traders like to draw this third parallel line half way between the two lines to give a visual indication of possible price actions.
Related Videos
Understanding the Importance of Support and Resistance 📈
https://www.youtube.com/watch?v=8YHdJEZHSHk
Support and Resistance Trading Strategy: Trading Support and Resistance Levels 📈
https://www.youtube.com/watch?v=BL--sBh6qhk
Why Support and Resistance Works: The Psychology Explained ☝
https://www.youtube.com/watch?v=fZY7rQ4_2zM
Change the Way you Look at Support and Resistance!
https://www.youtube.com/watch?v=ol_fwjsvchE
Buying at Support Trading Strategy 📈 Support Break, Unable to Hold
https://www.youtube.com/watch?v=YLU8o9dpxTA
How to use Trend Lines and Channels to Trade! 📈
https://www.youtube.com/watch?v=fDqVXtJlVEg
How To Draw And Use Trading Channels
https://www.youtube.com/watch?v=4gf07gt7-js&t=
Using Multiple Time Frame Analysis to Enhance Trading Success 📈
https://www.youtube.com/watch?v=rGLjp0YRdeA
How to Trade Breakouts: A Simple Strategy 💡
https://www.youtube.com/watch?v=DnOZW-7QYd4
Видео How to use Trend Lines and Channels to Trade! 📈 канала UKspreadbetting
There’s another way that you can include lines on your charts to help you figure out when to trade. You know about support and resistance levels, and these are represented by horizontal lines positioned at price turning points or reversals. But you can also use lines that slope in the direction of the market, and these are called trend lines.
When you have a trend, whether an uptrend or a downtrend, support and resistance levels are of marginal use. In an uptrend, you may find a resistance level is broken by the price going up then the price will retrace back down to the same level and find support before resuming a trend – but that’s about it. On the other hand, trend lines are sloped either up or down, depending on the trend, and may provide support/resistance many times during the trend.
Taking an uptrend for the first example, a trend line may be drawn sloping upwards, and connecting (roughly) the lowest price points touched as the price increases. As you can see from any chart, the price will never go up in a straight line but will always go up and down a little as it creeps up. The trend line connects those low points.
Finding and drawing a trend line is very subjective, and may not always be possible. But often you can draw a straight line that more or less connects several points, and provided the trend continues you will often find that this gives support every time the price comes back down. It’s worth looking at a few charts and practising so that you can see how this works.
Traders also draw what is called a channel. This is a sloping line drawn parallel to the trend line, but slid up to be over the top of the prices. Again, we are looking to connect many peaks of the price chart. Then with a well behaved price, you will find it oscillates in the channel formed by the two lines as it generally increases.
With a downtrend, the trend line is usually drawn first, sloping downward and connecting the successively lower price peaks, that is on top of all the price movements. Then the channel line can be drawn underneath the reducing prices. Again the principle is that the price will tend to remain between the two lines in the channel so formed.
You will find that some charts behave better than others when you’re trying to locate trend lines and channel lines. It won’t always be possible to draw straight lines connecting the points, but if you can it is a useful tool to help in your trading. Try not to be too accurate, but to look at the overall picture and figure out a commonsense solution.
Finally, just as you can see price movements gathering at the channel lines and being rebuffed, you may also see some price hesitation when the price passes over the middle between the two channel lines. Although it’s not strictly drawn as part of the channel, many traders like to draw this third parallel line half way between the two lines to give a visual indication of possible price actions.
Related Videos
Understanding the Importance of Support and Resistance 📈
https://www.youtube.com/watch?v=8YHdJEZHSHk
Support and Resistance Trading Strategy: Trading Support and Resistance Levels 📈
https://www.youtube.com/watch?v=BL--sBh6qhk
Why Support and Resistance Works: The Psychology Explained ☝
https://www.youtube.com/watch?v=fZY7rQ4_2zM
Change the Way you Look at Support and Resistance!
https://www.youtube.com/watch?v=ol_fwjsvchE
Buying at Support Trading Strategy 📈 Support Break, Unable to Hold
https://www.youtube.com/watch?v=YLU8o9dpxTA
How to use Trend Lines and Channels to Trade! 📈
https://www.youtube.com/watch?v=fDqVXtJlVEg
How To Draw And Use Trading Channels
https://www.youtube.com/watch?v=4gf07gt7-js&t=
Using Multiple Time Frame Analysis to Enhance Trading Success 📈
https://www.youtube.com/watch?v=rGLjp0YRdeA
How to Trade Breakouts: A Simple Strategy 💡
https://www.youtube.com/watch?v=DnOZW-7QYd4
Видео How to use Trend Lines and Channels to Trade! 📈 канала UKspreadbetting
Показать
Комментарии отсутствуют
Информация о видео
Другие видео канала
 Best Trend Lines Trading Strategy (Advanced)
 Horizontal vs Trend Lines in Forex, Which Are More Important? ✅
 How to Draw Trend Lines Correctly ☝
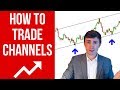 How to Trade Channels: Price Action Strategy 📈
 How to Draw Support and Resistance (My Secret Technique)
 How To Draw Trendlines Like A Pro (My Secret Technique) by Rayner Teo
 WHY DO MOST TRADERS LOSE!? ❓🎲🎭
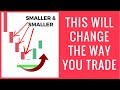 Best Price Action Trading Strategy That Will Change The Way You Trade
 Finally Revealing My Powerful Trendline Strategy.
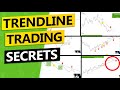 📈 Trendline Trading System - Full Course with Strategies
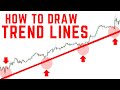 How to Draw Trend Lines in Forex (Step by Step)
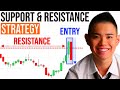 Support and Resistance Secrets: Powerful Strategies to Profit in Bull & Bear Markets
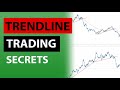 Trendline Trading Secrets + 3 trendline strategies
 The Importance of Market Structure | (Part 1)
 Master The PULLBACK TRADE (3 Strategies That Make BANK In Forex!...) and in stocks
 How To PROFIT In An Unpredictable Market (it's easier than you think)
 How to Trade Forex using Trendlines | Trendline Trading Strategy 📈
 How To Draw Trendlines The RIght Way - (Must Watch)
 The Proper Way to Draw Support and Resistance Lines! ✅