My new Proxmox Monitoring Tools: InfluxDB2 + Grafana
I recently added some new Monitoring Tools for my Proxmox Server at Home! I installed InfluxDB2 in Docker and used it as an external Metrics Server for Proxmox. Grafana is used to visualize the data in a nice Dashboard.
My current Monitoring Setup: https://www.youtube.com/watch?v=9TJx7QTrTyo
Boilerplates and Documentation: https://github.com/xcad2k/boilerplates
Cheat-Sheets for SSL Certs: https://github.com/xcad2k/cheat-sheets
Grafana Dashboard: https://grafana.com/grafana/dashboards/15356
Teleport-*: http://goteleport.com/thedigitallife
Follow me:
TWITTER: https://twitter.com/christian_tdl
INSTAGRAM: https://instagram.com/christian_tdl
DISCORD: https://discord.com/invite/bz2SN7d
GITHUB: https://github.com/xcad2k
BLOG: https://www.the-digital-life.com
PATREON: https://www.patreon.com/christianlempa
MY EQUIPMENT: https://kit.co/thedigitallife
Timestamps:
00:00 - Introduction
00:50 - My current monitoring setup
02:01 - The new setup
03:16 - InfluxDB2
06:50 - How to secure InfluxDB2?
10:24 - (Advertisement) Teleport-*
11:12 - Send Proxmox Metrics to InfluxDB2
14:10 - Visualize Metrics in Grafana
________________
All links with "*" are affiliate links.
Видео My new Proxmox Monitoring Tools: InfluxDB2 + Grafana канала The Digital Life
Показать
Комментарии отсутствуют
Информация о видео
Другие видео канала
 Before I do anything on Proxmox, I do this first...
 Dashboards for DAYS! - How we use Grafana in our #homelab!
 Meet Grafana LOKI, a Log Aggregation System for EVERYTHING
 Easily Install InfluxDB, Telegraf, & Grafana with Docker
 How to Virtualize Your Home Router / Firewall Using pfSense
 Home Assistant Data Visualisation with InfluxDB and Grafana
 your home router SUCKS!! (use pfSense instead)
 My Proxmox Basic Initial Setup
 How to protect Linux from Hackers // My server security strategy!
 Docker Networking Tutorial // ALL Network Types explained!
 Server Monitoring // Prometheus and Grafana Tutorial
 Perfect Proxmox Template with Cloud Image and Cloud Init
 How to create a valid self signed SSL Certificate?
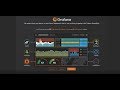 Configure Grafana With Zabbix Tutorial
 My crazy new Storage Server with TrueNAS Scale
 XCP NG VS Proxmox 2022 And Why I Chose...
![Grafana InfluxDB 2.x Installation [Flux ioBroker SmartHome Proxmox]](https://i.ytimg.com/vi/Jx7OeFlPr-8/default.jpg) Grafana InfluxDB 2.x Installation [Flux ioBroker SmartHome Proxmox]
Grafana InfluxDB 2.x Installation [Flux ioBroker SmartHome Proxmox] What's Running in my Home Server??? - 2021 Edition
 Home Lab Build - P.1 - Building a NAS