- Популярные видео
- Авто
- Видео-блоги
- ДТП, аварии
- Для маленьких
- Еда, напитки
- Животные
- Закон и право
- Знаменитости
- Игры
- Искусство
- Комедии
- Красота, мода
- Кулинария, рецепты
- Люди
- Мото
- Музыка
- Мультфильмы
- Наука, технологии
- Новости
- Образование
- Политика
- Праздники
- Приколы
- Природа
- Происшествия
- Путешествия
- Развлечения
- Ржач
- Семья
- Сериалы
- Спорт
- Стиль жизни
- ТВ передачи
- Танцы
- Технологии
- Товары
- Ужасы
- Фильмы
- Шоу-бизнес
- Юмор
#GoogleSheets Formulas Remove Errors and Save Time!
Welcome to our comprehensive guide on creating a powerful sales performance dashboard using Google Sheets! This tutorial will walk you through the process of building an insightful and visually appealing sales dashboard to track your product sales, analyze sales performance metrics, and make data-driven decisions to boost your business.
In this video, we'll cover the following key elements:
● Top 5 products: Identify and highlight your best-performing products.
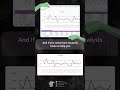
● Sales over time: Visualize your sales trends and patterns over specific periods.
● Sales by department and category: Gain insights into how different segments of your business are performing.
● Total sales and total units: Track overall sales volume and the number of units sold.
● Profit margin: Understand your profitability and make strategic adjustments.
We'll use only five essential formulas and focus on creating engaging charts to present the data effectively. Whether you're a seasoned Excel user or new to Google Sheets, this tutorial will simplify the process and help you create a simple but impactful sales dashboard that drives results.
Creating a sales dashboard doesn't have to be complicated. With our step-by-step guide, you can easily build a professional dashboard that provides real-time insights into your sales performance. This video is perfect for business owners, sales managers, and anyone looking to enhance their sales analysis skills using Google Sheets. Our approach will also touch upon creating an Excel dashboard, making it versatile for different users.
We'll show you how to:
● Set up your data in Google Sheets for optimal analysis.
● Use key formulas to calculate important sales metrics.
● Design visually appealing charts to represent your data.
● Customize your dashboard to fit your specific needs.
By the end of this tutorial, you'll have a fully functional sales performance dashboard that you can use to monitor your business's health and make informed decisions. Say goodbye to manual tracking and hello to a streamlined, automated solution!
Join us as we dive into the world of sales dashboards and unlock the power of Google Sheets. Don't forget to like, comment, and subscribe for more tutorials on sales performance, sales metrics, sales KPI dashboards, and more.
Let’s get started on building the best sales dashboards together!
Видео #GoogleSheets Formulas Remove Errors and Save Time! канала Google Sheets Fanboy
In this video, we'll cover the following key elements:
● Top 5 products: Identify and highlight your best-performing products.
● Sales over time: Visualize your sales trends and patterns over specific periods.
● Sales by department and category: Gain insights into how different segments of your business are performing.
● Total sales and total units: Track overall sales volume and the number of units sold.
● Profit margin: Understand your profitability and make strategic adjustments.
We'll use only five essential formulas and focus on creating engaging charts to present the data effectively. Whether you're a seasoned Excel user or new to Google Sheets, this tutorial will simplify the process and help you create a simple but impactful sales dashboard that drives results.
Creating a sales dashboard doesn't have to be complicated. With our step-by-step guide, you can easily build a professional dashboard that provides real-time insights into your sales performance. This video is perfect for business owners, sales managers, and anyone looking to enhance their sales analysis skills using Google Sheets. Our approach will also touch upon creating an Excel dashboard, making it versatile for different users.
We'll show you how to:
● Set up your data in Google Sheets for optimal analysis.
● Use key formulas to calculate important sales metrics.
● Design visually appealing charts to represent your data.
● Customize your dashboard to fit your specific needs.
By the end of this tutorial, you'll have a fully functional sales performance dashboard that you can use to monitor your business's health and make informed decisions. Say goodbye to manual tracking and hello to a streamlined, automated solution!
Join us as we dive into the world of sales dashboards and unlock the power of Google Sheets. Don't forget to like, comment, and subscribe for more tutorials on sales performance, sales metrics, sales KPI dashboards, and more.
Let’s get started on building the best sales dashboards together!
Видео #GoogleSheets Formulas Remove Errors and Save Time! канала Google Sheets Fanboy
sales dashboard dashboard excel dashboard google sheets google sheets dashboard simple excel dashboard excel dashboard in 4 steps sales analysis sales metrics sales performance sales kpi dashboard sales performance metrics best sales dashboards sales dashboard template excel dashboard tutorial google sheets tutorial sales analysis dashboard sales analysis project sales performance dashboard sales dashboard kpi google sheets tips and tricks sales kpi sale
Комментарии отсутствуют
Информация о видео
19 ч. 23 мин. назад
00:01:32
Другие видео канала