- Популярные видео
- Авто
- Видео-блоги
- ДТП, аварии
- Для маленьких
- Еда, напитки
- Животные
- Закон и право
- Знаменитости
- Игры
- Искусство
- Комедии
- Красота, мода
- Кулинария, рецепты
- Люди
- Мото
- Музыка
- Мультфильмы
- Наука, технологии
- Новости
- Образование
- Политика
- Праздники
- Приколы
- Природа
- Происшествия
- Путешествия
- Развлечения
- Ржач
- Семья
- Сериалы
- Спорт
- Стиль жизни
- ТВ передачи
- Танцы
- Технологии
- Товары
- Ужасы
- Фильмы
- Шоу-бизнес
- Юмор
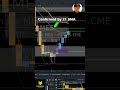
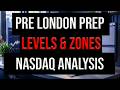
Nasdaq Top-Down Analysis: Daily to 5-Minute Footprint Chart Breakdown
In this video, I break down the Nasdaq using a full top-down analysis — starting from the Daily chart and working down through the lower timeframes all the way to the 5-minute chart.
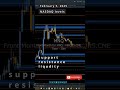
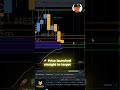
I focus on market structure, key levels, session context, and how footprint charts can help identify buyer and seller behavior in real time.
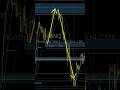
This breakdown is designed to show how I approach Nasdaq from a higher-timeframe perspective before looking for intraday trading opportunities.
Covered in this video:
Daily market context
Higher timeframe structure
Key support and resistance areas
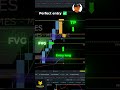
Intraday levels
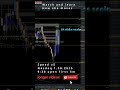
Footprint chart analysis
Buyer/seller absorption and aggression
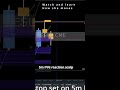
5-minute execution context
If you trade Nasdaq, futures, or intraday price action, this analysis may help you better understand how to build a structured trading plan from the top down.
Not financial advice.
#Nasdaq #NQ #FuturesTrading #DayTrading #FootprintCharts #OrderFlow #TradingAnalysis #PriceAction #TopDownAnalysis #MambafoxTrades
🔥 Get funded & watch full tools → linktr.ee/mambafox
1. Bulenox always best discount:
➡️ https://bulenox.com/member/aff/go/thefoxtrader
➡️ code: MAMBAFOX
2. Phidias Prop always best discount:
➡️https://member.phidiaspropfirm.com/aff/go/mambafox
➡️best discount code: MAMBAFOX
3. Get Funded with FTMO
➡️ https://trader.ftmo.com/?affiliates=JDLzcgCIsTflPzSjwydv
4. Get Funded with 5%ers
➡️ https://www.the5ers.com/?afmc=164h
----------------------------------------------------------------------------
Disclosure: Futures and crypto trading contains substantial risk and is not for every investor. An investor could potentially lose all or more than the initial investment. Risk capital is money that can be lost without jeopardizing ones’ financial security or life style. Only risk capital should be used for trading and only those with sufficient risk capital should consider trading. Past performance is not necessarily indicative of future results. Hypothetical Performance Disclosure: Hypothetical performance results have many inherent limitations, some of which are described below. no representation is being made that any account will or is likely to achieve profits or losses similar to those shown; in fact, there are frequently sharp differences between hypothetical performance results and the actual results subsequently achieved by any particular trading program. One of the limitations of hypothetical performance results is that they are generally prepared with the benefit of hindsight. In addition, hypothetical trading does not involve financial risk, and no hypothetical trading record can completely account for the impact of financial risk of actual trading. for example, the ability to withstand losses or to adhere to a particular trading program in spite of trading losses are material points which can also adversely affect actual trading results. There are numerous other factors related to the markets in general or to the implementation of any specific trading program which cannot be fully accounted for in the preparation of hypothetical performance results and all which can adversely affect trading results.
-------------------------------------------------------------------------------
Видео Nasdaq Top-Down Analysis: Daily to 5-Minute Footprint Chart Breakdown канала Mambafox Trades
I focus on market structure, key levels, session context, and how footprint charts can help identify buyer and seller behavior in real time.
This breakdown is designed to show how I approach Nasdaq from a higher-timeframe perspective before looking for intraday trading opportunities.
Covered in this video:
Daily market context
Higher timeframe structure
Key support and resistance areas
Intraday levels
Footprint chart analysis
Buyer/seller absorption and aggression
5-minute execution context
If you trade Nasdaq, futures, or intraday price action, this analysis may help you better understand how to build a structured trading plan from the top down.
Not financial advice.
#Nasdaq #NQ #FuturesTrading #DayTrading #FootprintCharts #OrderFlow #TradingAnalysis #PriceAction #TopDownAnalysis #MambafoxTrades
🔥 Get funded & watch full tools → linktr.ee/mambafox
1. Bulenox always best discount:
➡️ https://bulenox.com/member/aff/go/thefoxtrader
➡️ code: MAMBAFOX
2. Phidias Prop always best discount:
➡️https://member.phidiaspropfirm.com/aff/go/mambafox
➡️best discount code: MAMBAFOX
3. Get Funded with FTMO
➡️ https://trader.ftmo.com/?affiliates=JDLzcgCIsTflPzSjwydv
4. Get Funded with 5%ers
➡️ https://www.the5ers.com/?afmc=164h
----------------------------------------------------------------------------
Disclosure: Futures and crypto trading contains substantial risk and is not for every investor. An investor could potentially lose all or more than the initial investment. Risk capital is money that can be lost without jeopardizing ones’ financial security or life style. Only risk capital should be used for trading and only those with sufficient risk capital should consider trading. Past performance is not necessarily indicative of future results. Hypothetical Performance Disclosure: Hypothetical performance results have many inherent limitations, some of which are described below. no representation is being made that any account will or is likely to achieve profits or losses similar to those shown; in fact, there are frequently sharp differences between hypothetical performance results and the actual results subsequently achieved by any particular trading program. One of the limitations of hypothetical performance results is that they are generally prepared with the benefit of hindsight. In addition, hypothetical trading does not involve financial risk, and no hypothetical trading record can completely account for the impact of financial risk of actual trading. for example, the ability to withstand losses or to adhere to a particular trading program in spite of trading losses are material points which can also adversely affect actual trading results. There are numerous other factors related to the markets in general or to the implementation of any specific trading program which cannot be fully accounted for in the preparation of hypothetical performance results and all which can adversely affect trading results.
-------------------------------------------------------------------------------
Видео Nasdaq Top-Down Analysis: Daily to 5-Minute Footprint Chart Breakdown канала Mambafox Trades
gold futures MGC MGC futures GC GC futures gold trading gold top down analysis top down analysis multi timeframe analysis daily levels price action volume profile point of control POC trading candle POC footprint chart order flow orderflow trading volume delta absorption imbalances futures trading day trading gold gold scalping COMEX gold CME futures trading plan intraday trading trading education trading strategy Mambafox Trades
Комментарии отсутствуют
Информация о видео
29 апреля 2026 г. 10:05:10
00:08:27
Другие видео канала