- Популярные видео
- Авто
- Видео-блоги
- ДТП, аварии
- Для маленьких
- Еда, напитки
- Животные
- Закон и право
- Знаменитости
- Игры
- Искусство
- Комедии
- Красота, мода
- Кулинария, рецепты
- Люди
- Мото
- Музыка
- Мультфильмы
- Наука, технологии
- Новости
- Образование
- Политика
- Праздники
- Приколы
- Природа
- Происшествия
- Путешествия
- Развлечения
- Ржач
- Семья
- Сериалы
- Спорт
- Стиль жизни
- ТВ передачи
- Танцы
- Технологии
- Товары
- Ужасы
- Фильмы
- Шоу-бизнес
- Юмор
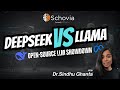
Principal Component Analysis (PCA) Explained Visually
Data isn't just 3D—often, it’s 10-dimensional, 100-dimensional, or more. How do you find a pattern when you can't even visualize the space? Enter PCA: the ultimate tool for collapsing high-dimensional complexity into actionable 2D or 3D insights.
In this video from Schovia Labs, you’ll learn how to simplify high-dimensional data into fewer dimensions for faster models and easier visualization without throwing away the big picture.
We break down the geometric intuition behind the best angles, look under the hood at the underlying math, and cover the practical trade-offs you need to know before applying it to your own models.
You’ll also understand why PCA is a go-to choice when your goal is compression, visualization, denoising, or building faster downstream models.
👨💻Get the Python Notebook: https://schovia.com/demos/principal-component-analysis
🧠What you’ll learn
- How to build the geometric intuition behind the best viewing angles
- How PCA rotates the coordinate system and projects data to preserve most of the information
- Why PCA is an unsupervised tool that does not look at class labels
- The math under the hood: Covariance matrices, eigenvectors, and eigenvalues
- Why standardizing feature scales is crucial to avoid nonsense results
- Why PCA is blind to curves and when to use alternatives like t-SNE or UMAP
🕛Timestamps
00:00 – The 3D object intuition
00:48 – Welcome to Schovia and visualizing 3D point clouds
02:05 – How PCA rotates and projects data
02:35 – Why variance matters in your dataset
03:35 – The unsupervised nature of PCA
04:16 – Step two: The math under the hood
04:47 – Extracting eigenvectors and eigenvalues
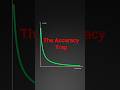
06:43 – Quantifying with explained variance
06:57 – Practical rules and common pitfalls
08:11 – When PCA fails: non-linear relationships and curves
08:45 – Python pipeline code in the description
🔖Hashtags
#AI #MachineLearning #DataScience #PCA #PrincipalComponentAnalysis #Python #ArtificialIntelligence #Schovia #DataVisualization
👩🏫About the Presenter:
Dr. Sindhu Ghanta delivers clear, practical, and mathematically intuitive explanations for complex machine learning algorithms. Her/Our style? No jargon. Just clear, useful explanations that help you learn fast and apply your skills immediately.
🚀Learn More & Subscribe: Subscribe to @Schovia for weekly AI tutorials, simplified tech, and the latest trends.
🔗Explore More at Schovia: https://schovia.com/
🔔Like, comment, and subscribe for new videos every Tuesday!
Видео Principal Component Analysis (PCA) Explained Visually канала Schovia
In this video from Schovia Labs, you’ll learn how to simplify high-dimensional data into fewer dimensions for faster models and easier visualization without throwing away the big picture.
We break down the geometric intuition behind the best angles, look under the hood at the underlying math, and cover the practical trade-offs you need to know before applying it to your own models.
You’ll also understand why PCA is a go-to choice when your goal is compression, visualization, denoising, or building faster downstream models.
👨💻Get the Python Notebook: https://schovia.com/demos/principal-component-analysis
🧠What you’ll learn
- How to build the geometric intuition behind the best viewing angles
- How PCA rotates the coordinate system and projects data to preserve most of the information
- Why PCA is an unsupervised tool that does not look at class labels
- The math under the hood: Covariance matrices, eigenvectors, and eigenvalues
- Why standardizing feature scales is crucial to avoid nonsense results
- Why PCA is blind to curves and when to use alternatives like t-SNE or UMAP
🕛Timestamps
00:00 – The 3D object intuition
00:48 – Welcome to Schovia and visualizing 3D point clouds
02:05 – How PCA rotates and projects data
02:35 – Why variance matters in your dataset
03:35 – The unsupervised nature of PCA
04:16 – Step two: The math under the hood
04:47 – Extracting eigenvectors and eigenvalues
06:43 – Quantifying with explained variance
06:57 – Practical rules and common pitfalls
08:11 – When PCA fails: non-linear relationships and curves
08:45 – Python pipeline code in the description
🔖Hashtags
#AI #MachineLearning #DataScience #PCA #PrincipalComponentAnalysis #Python #ArtificialIntelligence #Schovia #DataVisualization
👩🏫About the Presenter:
Dr. Sindhu Ghanta delivers clear, practical, and mathematically intuitive explanations for complex machine learning algorithms. Her/Our style? No jargon. Just clear, useful explanations that help you learn fast and apply your skills immediately.
🚀Learn More & Subscribe: Subscribe to @Schovia for weekly AI tutorials, simplified tech, and the latest trends.
🔗Explore More at Schovia: https://schovia.com/
🔔Like, comment, and subscribe for new videos every Tuesday!
Видео Principal Component Analysis (PCA) Explained Visually канала Schovia
Комментарии отсутствуют
Информация о видео
4 марта 2026 г. 4:00:50
00:09:13
Другие видео канала