- Популярные видео
- Авто
- Видео-блоги
- ДТП, аварии
- Для маленьких
- Еда, напитки
- Животные
- Закон и право
- Знаменитости
- Игры
- Искусство
- Комедии
- Красота, мода
- Кулинария, рецепты
- Люди
- Мото
- Музыка
- Мультфильмы
- Наука, технологии
- Новости
- Образование
- Политика
- Праздники
- Приколы
- Природа
- Происшествия
- Путешествия
- Развлечения
- Ржач
- Семья
- Сериалы
- Спорт
- Стиль жизни
- ТВ передачи
- Танцы
- Технологии
- Товары
- Ужасы
- Фильмы
- Шоу-бизнес
- Юмор
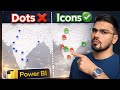
How to Create a Lollipop Chart in Power BI (Native Visual) | Modern Dashboard Trick
Learn how to create a Lollipop Chart in Power BI using only native visuals—no custom visuals or AppSource downloads required. In this step-by-step tutorial, you'll master a modern and minimalistic chart design perfect for business dashboards, finance reports, and executive presentations.
You’ll see how to use a simple combination of bar charts and markers to create a clean, professional Lollipop Chart that enhances readability and reduces visual clutter. This technique is widely used in data storytelling, KPI visuals, and modern UX-focused Power BI dashboards.
In this video, you will learn:
✅ What a Lollipop Chart is and when to use it
✅ How to build it using Power BI native visuals
✅ How to format & customize the marker/dot
✅ How to use it in Finance, Sales & Business reports
✅ Best practices for dashboard design
✅ Tips for modern and clean report layouts
If you’re building dashboards for clients or preparing for Power BI interviews, this is a must-know visualization technique.
— — — — — — — — — — — — — — — — — — — — — — —
🚀 Need 1:1 help with Power BI? Connect with me on Topmate:
https://topmate.io/bi_tricks
— — — — — — — — — — — — — — — — — — — — — — —
📦 Interested in purchasing my Power BI Reports?
🔹 Superstore Analytics Dashboard – An end-to-end sales analytics solution with KPIs, trends & segmentation
👉 https://topmate.io/bi_tricks/1639810
🔹 Pizza Sales Dashboard – A single-page visual report packed with insights on product, category, and time analysis
👉 https://topmate.io/bi_tricks/1646375
— — — — — — — — — — — — — — — — — — — — — — —
💼 Want to hire me for a Power BI project?
Visit my Upwork profile to get started:
https://www.upwork.com/freelancers/~01c98342e5ad0a9bdc?mp_source=share
— — — — — — — — — — — — — — — — — — — — — — —
🔗 Follow me on LinkedIn:
https://www.linkedin.com/in/ashish-kumar-jha-2392b0133/
— — — — — — — — — — — — — — — — — — — — — — —
🔍 Your Queries:
power bi lollipop chart,powerbi lollipop chart,lollypop chart power bi,how to create lollipop chart power bi,power bi lollipop native visual,power bi dashboard tutorial,power bi design tips,power bi chart tutorial,power bi report design,power bi business dashboard,power bi finance dashboard,power bi visualization tutorial,power bi bar chart tricks,power bi data visualization,powerbi visual design,lollipop chart tutorial,lollipop powerbi,
— — — — — — — — — — — — — — — — — — — — — — —
🏷️Tags
Power BI, Power BI tutorial, Power BI dashboard, Power BI report, Power Query, DAX, business intelligence, Power BI for beginners, Power BI tips, data analysis, Power BI training, Power BI tricks
#PowerBI #DataAnalysis #PowerBITutorial #PowerQuery #DAX
Видео How to Create a Lollipop Chart in Power BI (Native Visual) | Modern Dashboard Trick канала BI Tricks
Power BI DAX Power Query Data Modeling Microsoft Power BI Power BI end to end project How to Power BI Power BI Interviews Power BI Updates power bi lollipop chart powerbi lollipop chart how to create lollipop chart power bi power bi lollipop native visual power bi dashboard tutorial power bi design tips power bi report design power bi business dashboard power bi finance dashboard power bi bar chart tricks lollipop chart tutorial lollipop powerbi
Комментарии отсутствуют
Информация о видео
17 ноября 2025 г. 10:30:19
00:04:02
Другие видео канала