How to create an epidemic curve
Epidemic curves are an important component of the public health and global health toolbox. During an outbreak of an infectious disease, public health professionals and epidemiologists create visual representations of the onset of illness of cases over time. This video focusses on how to create an epidemic curve. The next video will cover concepts like the incubation period and the latent period.
This video was created with support from the University of Notre Dame. Find out more about their program here: http://ntrda.me/2btUrXb
-~-~~-~~~-~~-~-
Please watch: "Know how interpret an epidemic curve?"
https://www.youtube.com/watch?v=7SM4PN7Yg1s
-~-~~-~~~-~~-~-
Видео How to create an epidemic curve канала Global Health with Greg Martin
Показать
Комментарии отсутствуют
Информация о видео
23 декабря 2016 г. 20:00:04
00:08:50
Другие видео канала
 Know how to interpret an epidemic curve?
 Randomized Control Trials and Confounding
 How to get Global Health Field Experience - getting ready for your career in public health
 Statistics made easy ! ! ! Learn about the t-test, the chi square test, the p value and more
 Create epidemiology | Epid curve in excel for outbreak investigation management | Disease Status
 Qualitative research methods
 Amazing Graphs - Numberphile
 How to Create an Epi Curve in Excel
 Creating Easy Data Entry Forms in Excel
 R0 and vaccine coverage. How to use a COVID-19 vaccine to get to herd immunity and beat Coronavirus
 "Epidemic Curves" in 3 Minutes
 Creating an Epidemic Curve in Excel
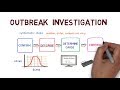 Outbreak Investigation - a step by step approach
 Universal Health Coverage explained
 Addressing the Complexity of Public Health | Chris Dickey | TEDxNYU
 Understanding missing data and missing values. 5 ways to deal with missing data using R programming
 R programming for beginners – statistic with R (t-test and linear regression) and dplyr and ggplot
 How We’re Fooled By Statistics
 Epidemiological Studies - made easy!
 Cohort and Case Control Studies