Graph The Efficient Frontier And Capital Allocation Line In Excel
Graph The Efficient Frontier And Capital Allocation Line In Excel by Ryan O'Connell, CFA, FRM
0:00 - Download Historical Data from Yahoo Finance
0:42 - Calculate Returns from Historical Prices
1:08 - Calculate Asset's Average Return, Standard Deviation, and Covariance
2:18 - Assign Portfolio Weights
2:56 - Calculate Portfolio Expected Return
3:27 - Calculate Portfolio Standard Deviation
5:03 - Calculate Portfolio Sharpe Ratio
5:47 - Graph the Efficient Frontier
6:40 - Graph the Capital Allocation Line (CAL)
Download the file made in this video for free here!
https://github.com/oryan5000/YouTubeFiles/blob/main/Efficient%20Frontier.zip
For all business inquiries, please reach out to the following email:
roconnellcfa@gmail.com
*Disclosure: This is not financial advice and should not be taken as such. The information contained in this video is an opinion. Some of the information could be wrong. This channel is owned and operated by Portfolio Constructs LLC
Видео Graph The Efficient Frontier And Capital Allocation Line In Excel канала Ryan O'Connell, CFA
Показать
Комментарии отсутствуют
Информация о видео
Другие видео канала
 Use Excel to graph the efficient frontier of a three security portfolio
 The Efficient Frontier - Explained in 3 Minutes
![CFA/FRM : How to Build Efficient Frontier in Excel- CAL and Use of Sharpe Ratio [Part 2 of 2]](https://i.ytimg.com/vi/CP3pH3Pjz1A/default.jpg) CFA/FRM : How to Build Efficient Frontier in Excel- CAL and Use of Sharpe Ratio [Part 2 of 2]
CFA/FRM : How to Build Efficient Frontier in Excel- CAL and Use of Sharpe Ratio [Part 2 of 2]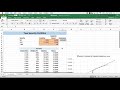 Portfolio Optimization Seven Security Example with Excel Solver
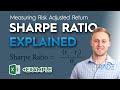 How To Use The Sharpe Ratio + Calculate In Excel
 describe and interpret the minimum-variance and efficient frontiers of risky assets and..
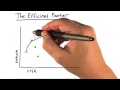 The efficient frontier
 Four Stock Portfolio and Graphing Efficient Portfolio Frontier
 Calculating the Optimal Portfolio in Excel
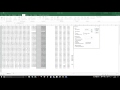 How to Calculate Fama French in Excel
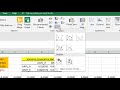 Plotting portfolio frontier for two and more stocks portfolios
 #Intraday Trading for Beginners | How to Earn Profits from #StockMarket? | Live Trading
 Introduction to Pivot Tables, Charts, and Dashboards in Excel (Part 1)
 Risk and Return: Portfolio【Deric Business Class】
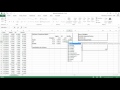 Portfolio Optimizer in Excel
 Chapter 10 - The Minimum Variance Portfolio and the Efficient Frontier
 Graphing the efficient frontier for a two-stock portfolio in Excel
 Tutorial: Constructing Efficient Frontier using Markowitz model
 How to plot the Efficient Frontier in Excel: Three Assets
 Capital Allocation Line