- Популярные видео
- Авто
- Видео-блоги
- ДТП, аварии
- Для маленьких
- Еда, напитки
- Животные
- Закон и право
- Знаменитости
- Игры
- Искусство
- Комедии
- Красота, мода
- Кулинария, рецепты
- Люди
- Мото
- Музыка
- Мультфильмы
- Наука, технологии
- Новости
- Образование
- Политика
- Праздники
- Приколы
- Природа
- Происшествия
- Путешествия
- Развлечения
- Ржач
- Семья
- Сериалы
- Спорт
- Стиль жизни
- ТВ передачи
- Танцы
- Технологии
- Товары
- Ужасы
- Фильмы
- Шоу-бизнес
- Юмор
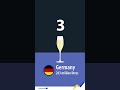
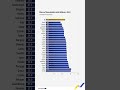
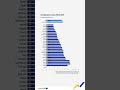
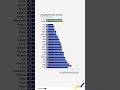
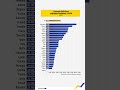
Visualisations bring data to life | SnapStat 📊 📉
Visualising statistics helps us making sense of complex data to understand today’s world a bit better and get our facts right.
Join us for a 15 minutes presentation to find out about the range of interactive data visualisation tools provided by Eurostat, which cover topics like environment, economy, regions, and social conditions, and discover how they can be useful for you
Depending on your interests, needs, and knowledge of statistics, you can then go on and explore the more than 30 available different tools by yourself.
#AskEurostat
Видео Visualisations bring data to life | SnapStat 📊 📉 канала Eurostat
Комментарии отсутствуют
Информация о видео
17 февраля 2026 г. 15:00:53
00:15:30
Другие видео канала