GANTT chart visuals in Power BI
In this video I take a closer look at two certified visuals that create a GANTT chart in Power BI. You can use the visuals to recreate a schedule or a project center view. As long as you have a name, start and finish date you are all set to go and create nice visuals. The two visials have their own ups and downs. Hope you like this review for the visials "Gantt" and "Gantt chart by MAQ Software".
Keep in mind that content I show on the video's is mostly available to you if you subscribe to the newsletter: http://eepurl.com/dsm7dj
Видео GANTT chart visuals in Power BI канала The Project Corner Vlog
Keep in mind that content I show on the video's is mostly available to you if you subscribe to the newsletter: http://eepurl.com/dsm7dj
Видео GANTT chart visuals in Power BI канала The Project Corner Vlog
Показать
Комментарии отсутствуют
Информация о видео
14 ноября 2018 г. 17:00:03
00:10:28
Другие видео канала
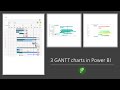 3 additional Power BI GANTT charts
 Microsoft Project for the web – Power BI Template
 Power BI Full Course - Learn Power BI in 4 Hours | Power BI Tutorial for Beginners | Edureka
 Power BI Custom Visuals - Timeline Storyteller
 How to Make a Gantt Chart in Excel
 Interactive Excel Project Management Dashboard - FREE Download
 7 Tips & Tricks for Stunning Power BI Reports!
 Exploring the Chiclet Slicer visual in Power BI
 Project Plan in Excel with Gantt Chart (Plan, Actual & Progress in ONE VIEW)
 Taking Buttons in Power BI Desktop to the Next Level
 Project Online & Power BI: #045 - Gantt Chart com KPIs
 Build a Slicer Panel in Power BI and take it to the next level
 Power BI Tutorial From Beginner to Pro ⚡ Desktop to Dashboard in 60 Minutes ⏰
 Create a Power BI Dashboard for Microsoft Project Online
 Power BI Custom Visuals - Gantt
 Project Online & Power BI: #012 - Gantt Chart Visual (Cronograma)
 #50 Power BI Cronograma - Gráfico Gantt
 Timeline visuals in Power BI
 Create A Gantt Chart In Power BI With A Matrix Visual
 Create allocation table and visualize it in a Gantt Charts with matrix in Power Query