- Популярные видео
- Авто
- Видео-блоги
- ДТП, аварии
- Для маленьких
- Еда, напитки
- Животные
- Закон и право
- Знаменитости
- Игры
- Искусство
- Комедии
- Красота, мода
- Кулинария, рецепты
- Люди
- Мото
- Музыка
- Мультфильмы
- Наука, технологии
- Новости
- Образование
- Политика
- Праздники
- Приколы
- Природа
- Происшествия
- Путешествия
- Развлечения
- Ржач
- Семья
- Сериалы
- Спорт
- Стиль жизни
- ТВ передачи
- Танцы
- Технологии
- Товары
- Ужасы
- Фильмы
- Шоу-бизнес
- Юмор
MongoDB Monitoring with Prometheus & Grafana 🚀 #mongodb #prometheus #grafana
🎥 YouTube full video:
https://youtu.be/_lvHtgMcL-0
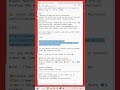
Full setup for MongoDB Monitoring using Prometheus + Grafana on Ubuntu 24.04 LTS using the latest MongoDB 8.x
Environment used:
+ -------------------------- + ------- + --------------- + ---- +
| Component | Server | IP | Port |
+ -------------------------- + ------- + --------------- + ---- +
| MongoDB + MongoDB Exporter | Server1 | 192.168.136.128 | 9216 |
| Prometheus | Server2 | 192.168.136.129 | 9090 |
| Grafana | Server2 | 192.168.136.129 | 3000 |
+ -------------------------- + ------- + --------------- + ---- +
Password example: admin@123
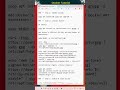
# ✅ Final Architecture
+ ------------------ + ------- + --------------- + ---- +
| Component | Server | IP | Port |
+ ------------------ + ------- + --------------- + ---- +
| MongoDB + Exporter | Server1 | 192.168.136.128 | 9216 |
| Prometheus | Server2 | 192.168.136.129 | 9090 |
| Grafana | Server2 | 192.168.136.129 | 3000 |
+ ------------------ + ------- + --------------- + ---- +
✅ MongoDB monitoring with Prometheus and Grafana is now fully configured.
--------------------------------------------------------------------
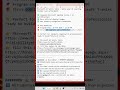
######## ⚠️ Disclaimer / अस्वीकरण ########
1️⃣ All trademarks, logos, and names belong to their respective owners.
2️⃣ This video is made only for educational & informational purposes under Fair Use (Section 107, Copyright Act 1976).
3️⃣ No copyright infringement intended.
4️⃣ For any copyright concerns, email 📩 inchirags@gmail.com — action will be taken promptly.
## 🌐 👇 Follow & Support:
🎥 YouTube: https://www.youtube.com/@ChiragMahtoOfficial
📷 Instagram: https://www.instagram.com/chirag_._mahto
💼 LinkedIn: https://linkedin.com/in/chittrmahto
📘 Facebook: https://www.facebook.com/chittrmahto
💬 WhatsApp Channel: https://whatsapp.com/channel/0029VbBgm16002T93KB16U12
💬 Telegram Channel: https://t.me/+GAATbmOU4z1mMDY9
📘 Note: Follow the process exactly as shown in the video.
✨ Share this tutorial with your friends & colleagues!
💬 Drop your questions in the YouTube comments — I’ll reply personally.
🔔 Subscribe for FREE tutorial and Certification Tutorials!
🔥 Don’t forget to 💛 LIKE, 💘 SHARE, 💝 COMMENT, & 💙 SUBSCRIBE to @ChiragMahtoOfficial 💯
Thanks & Regards,
💫 Chitt Ranjan Mahto — “CHIRAG” 💫
🌍 https://www.chirags.in
#chiragmahtooffcial #chiragtutorial #chirag #chittranjanmahto #chiragmahto #mongodb #prometheus #grafana #mongodbmonitoring #prometheusmongodb #grafanamongodb #devopsmonitoring #ubuntu2404 #mongodb80 #devopstutorial
Видео MongoDB Monitoring with Prometheus & Grafana 🚀 #mongodb #prometheus #grafana канала Chirag Mahto
https://youtu.be/_lvHtgMcL-0
Full setup for MongoDB Monitoring using Prometheus + Grafana on Ubuntu 24.04 LTS using the latest MongoDB 8.x
Environment used:
+ -------------------------- + ------- + --------------- + ---- +
| Component | Server | IP | Port |
+ -------------------------- + ------- + --------------- + ---- +
| MongoDB + MongoDB Exporter | Server1 | 192.168.136.128 | 9216 |
| Prometheus | Server2 | 192.168.136.129 | 9090 |
| Grafana | Server2 | 192.168.136.129 | 3000 |
+ -------------------------- + ------- + --------------- + ---- +
Password example: admin@123
# ✅ Final Architecture
+ ------------------ + ------- + --------------- + ---- +
| Component | Server | IP | Port |
+ ------------------ + ------- + --------------- + ---- +
| MongoDB + Exporter | Server1 | 192.168.136.128 | 9216 |
| Prometheus | Server2 | 192.168.136.129 | 9090 |
| Grafana | Server2 | 192.168.136.129 | 3000 |
+ ------------------ + ------- + --------------- + ---- +
✅ MongoDB monitoring with Prometheus and Grafana is now fully configured.
--------------------------------------------------------------------
######## ⚠️ Disclaimer / अस्वीकरण ########
1️⃣ All trademarks, logos, and names belong to their respective owners.
2️⃣ This video is made only for educational & informational purposes under Fair Use (Section 107, Copyright Act 1976).
3️⃣ No copyright infringement intended.
4️⃣ For any copyright concerns, email 📩 inchirags@gmail.com — action will be taken promptly.
## 🌐 👇 Follow & Support:
🎥 YouTube: https://www.youtube.com/@ChiragMahtoOfficial
📷 Instagram: https://www.instagram.com/chirag_._mahto
💼 LinkedIn: https://linkedin.com/in/chittrmahto
📘 Facebook: https://www.facebook.com/chittrmahto
💬 WhatsApp Channel: https://whatsapp.com/channel/0029VbBgm16002T93KB16U12
💬 Telegram Channel: https://t.me/+GAATbmOU4z1mMDY9
📘 Note: Follow the process exactly as shown in the video.
✨ Share this tutorial with your friends & colleagues!
💬 Drop your questions in the YouTube comments — I’ll reply personally.
🔔 Subscribe for FREE tutorial and Certification Tutorials!
🔥 Don’t forget to 💛 LIKE, 💘 SHARE, 💝 COMMENT, & 💙 SUBSCRIBE to @ChiragMahtoOfficial 💯
Thanks & Regards,
💫 Chitt Ranjan Mahto — “CHIRAG” 💫
🌍 https://www.chirags.in
#chiragmahtooffcial #chiragtutorial #chirag #chittranjanmahto #chiragmahto #mongodb #prometheus #grafana #mongodbmonitoring #prometheusmongodb #grafanamongodb #devopsmonitoring #ubuntu2404 #mongodb80 #devopstutorial
Видео MongoDB Monitoring with Prometheus & Grafana 🚀 #mongodb #prometheus #grafana канала Chirag Mahto
Chirag Mahto Official Chirag Tutorial Chirag Chitt Ranjan Mahto Chirag Mahto MongoDB Monitoring Tutorial MongoDB 8.0 Monitoring Prometheus MongoDB Exporter Grafana MongoDB Dashboard DevOps Monitoring Setup Prometheus Grafana Tutorial Ubuntu 24.04 Server Monitoring MongoDB Performance Monitoring Database Monitoring DevOps Production MongoDB Monitoring Prometheus Alerting DevOps Observability Stack Tutorial Cloud Native Monitoring Guide
Комментарии отсутствуют
Информация о видео
3 апреля 2026 г. 17:32:31
00:02:21
Другие видео канала