- Популярные видео
- Авто
- Видео-блоги
- ДТП, аварии
- Для маленьких
- Еда, напитки
- Животные
- Закон и право
- Знаменитости
- Игры
- Искусство
- Комедии
- Красота, мода
- Кулинария, рецепты
- Люди
- Мото
- Музыка
- Мультфильмы
- Наука, технологии
- Новости
- Образование
- Политика
- Праздники
- Приколы
- Природа
- Происшествия
- Путешествия
- Развлечения
- Ржач
- Семья
- Сериалы
- Спорт
- Стиль жизни
- ТВ передачи
- Танцы
- Технологии
- Товары
- Ужасы
- Фильмы
- Шоу-бизнес
- Юмор
Stop Using Messy Data. This New Table Feature Changes Everything (Google sheet tutorial)
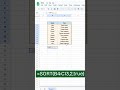
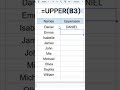
In this video, you’ll learn how to turn messy, unorganized data into a clean and structured table using a new table feature that makes everything easier to manage. If your data ever feels confusing, scattered, or hard to read, this method will help you fix it instantly by giving it structure and clarity.
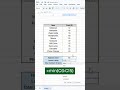
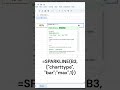
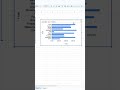
You’ll see step by step how to convert raw data into a proper table, so everything becomes organized and easier to work with. This is especially useful if you’re following a Google Sheets tutorial style workflow and want to handle data more efficiently. Then we go deeper into grouping values to understand patterns better, especially when dealing with different categories inside your data.
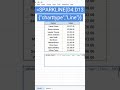
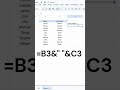
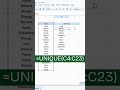
We also cover column types like numbers, dropdowns, and checkboxes, which help you make your table more flexible and interactive. On top of that, I show you how to format and style the table so it becomes not just functional but also clean and easy on the eyes.
By the end of this video, you’ll understand how small table features can completely change the way you read and analyze data. Instead of guessing or feeling lost, you’ll be able to quickly organize, filter, and understand any dataset in just a few clicks.
This method works great for anyone using Google Sheets tutorial, working with lists, records, tracking sheets, or any kind of structured information where clarity matters.
#googlesheets #tutorial #spreadsheet
Видео Stop Using Messy Data. This New Table Feature Changes Everything (Google sheet tutorial) канала WellUp
You’ll see step by step how to convert raw data into a proper table, so everything becomes organized and easier to work with. This is especially useful if you’re following a Google Sheets tutorial style workflow and want to handle data more efficiently. Then we go deeper into grouping values to understand patterns better, especially when dealing with different categories inside your data.
We also cover column types like numbers, dropdowns, and checkboxes, which help you make your table more flexible and interactive. On top of that, I show you how to format and style the table so it becomes not just functional but also clean and easy on the eyes.
By the end of this video, you’ll understand how small table features can completely change the way you read and analyze data. Instead of guessing or feeling lost, you’ll be able to quickly organize, filter, and understand any dataset in just a few clicks.
This method works great for anyone using Google Sheets tutorial, working with lists, records, tracking sheets, or any kind of structured information where clarity matters.
#googlesheets #tutorial #spreadsheet
Видео Stop Using Messy Data. This New Table Feature Changes Everything (Google sheet tutorial) канала WellUp
Комментарии отсутствуют
Информация о видео
18 апреля 2026 г. 14:45:35
00:01:56
Другие видео канала