How to add a chart to a Salesforce Lightning report
One of the things that many Salesforce users struggle with is how to create visual summary reports that are easy to digest and understand. In this video I will show you how to take your Salesforce Lightning reports and add visual report charts so you can view your data graphically.
You will learn how to:
1. Group rows to enable the add chart option
2. Group columns to create summary reports
3. Customize your chart using chart properties
__________
Say hi on social:
LinkedIn: https://www.linkedin.com/in/farahcharania/
Twitter: https://twitter.com/signiforce
Видео How to add a chart to a Salesforce Lightning report канала Signiforce
Показать
Комментарии отсутствуют
Информация о видео
Другие видео канала
 Add report chart to Salesforce Lightning Page Layout
 Salesforce Report Formulas using Lightning Report Builder
 Matrix Reports in Salesforce | How to Create a Matrix Report in Salesforce | Salesforce Reporting
 Lightning Fast Salesforce Training: Sales KPI Dashboard
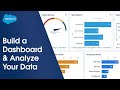 How to Build a Dashboard in Lightning Experience | Salesforce
 Reports and Dashboards In Salesforce | Salesforce For Beginners | Salesforce Training | Edureka
 Summary Reports in Salesforce | How to Create a Summary Report in Salesforce | Salesforce Reporting
 Customize Salesforce Lightning Home page
 Fetch all picklist type fields available on salesforce object in LWC | using apex
 Salesforce Tutorial For Beginners | Introduction To Salesforce | Salesforce Training | Simplilearn
 Work with GeoJSON and Create the Map || Tableau CRM Salesforce
 How to add charts and diagrams to SharePoint online page (Quick chart)
 How to Display a Lightning Page Related Record Component in Salesforce.
 Salesforce Rollup summary fields|Salesforce tutorial for Beginners
![Flow to create Contact Forms with Upload Files screen component | [Salesforce Flows] -Salesforcegeek](https://i.ytimg.com/vi/tz9ZAJ8_gbU/default.jpg) Flow to create Contact Forms with Upload Files screen component | [Salesforce Flows] -Salesforcegeek
Flow to create Contact Forms with Upload Files screen component | [Salesforce Flows] -Salesforcegeek Salesforce Dashboards
 Do More with Salesforce Reports and Dashboards
 Add a new donor and donation | Salesforce NPSP Basics Series | Salesforce Donation Management
 How to Customize Lightning Homepages in Salesforce
 How to create a report in Salesforce 2021