- Популярные видео
- Авто
- Видео-блоги
- ДТП, аварии
- Для маленьких
- Еда, напитки
- Животные
- Закон и право
- Знаменитости
- Игры
- Искусство
- Комедии
- Красота, мода
- Кулинария, рецепты
- Люди
- Мото
- Музыка
- Мультфильмы
- Наука, технологии
- Новости
- Образование
- Политика
- Праздники
- Приколы
- Природа
- Происшествия
- Путешествия
- Развлечения
- Ржач
- Семья
- Сериалы
- Спорт
- Стиль жизни
- ТВ передачи
- Танцы
- Технологии
- Товары
- Ужасы
- Фильмы
- Шоу-бизнес
- Юмор
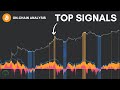
Why Bitcoin Compounding Looks Wrong on Paper
In this video, we break down why Bitcoin compounding often looks misleading on paper and how traditional return metrics like CAGR can distort the real picture of long-term performance. Most investors focus on start and end points, but this hides the true structure of Bitcoin’s growth.
We introduce a more robust framework using the 200-week moving average to better understand Bitcoin’s structural compounding rate and how volatility, when properly harnessed through dollar-cost averaging, can become a long-term performance advantage rather than a risk factor.
You’ll learn how Bitcoin’s true growth rate behaves across cycles, why random entry points produce wildly different CAGR outcomes, and how the 200-week trend provides a cleaner proxy for underlying network expansion. We also compare this framework to traditional assets like the S&P 500 and leveraged indices to show how structural compounding behaves across different risk profiles.
This is a deep dive into Bitcoin structure, long-term valuation frameworks, and why most return calculations fail to capture the real mechanics of compounding in high-growth digital assets.
👉🏼 Subscribe here for my free on-chain analysis newsletter and my NEW charting platform: http://onchainmind.io
#Bitcoin #OnChainAnalysis #BitcoinCAGR #200WeekMovingAverage #BitcoinAnalysis
Видео Why Bitcoin Compounding Looks Wrong on Paper канала On-Chain Mind
Bitcoin On-Chain Analysis Bitcoin Metrics Crypto Analysis Bitcoin Trading Bitcoin Price Glassnode CryptoQuant Bitcoin Analysis Crypto Investing Bitcoin Blockchain MVRV SOPR NUPL Bitcoin Market Cycle BTC Price Crypto Data Analysis Bitcoin Price Prediction Crypto Bull Market Bitcoin Bear Market Bitcoin Insights Cryptocurrency Analysis GlassnodeInsights BTC Metrics On-Chain Metrics Bitcoin On-Chain Bitcoin On-Chain Analysis BTC Btc cagr Cagr Bitcoin cagr
Комментарии отсутствуют
Информация о видео
1 мая 2026 г. 21:05:50
00:11:52
Другие видео канала