- Популярные видео
- Авто
- Видео-блоги
- ДТП, аварии
- Для маленьких
- Еда, напитки
- Животные
- Закон и право
- Знаменитости
- Игры
- Искусство
- Комедии
- Красота, мода
- Кулинария, рецепты
- Люди
- Мото
- Музыка
- Мультфильмы
- Наука, технологии
- Новости
- Образование
- Политика
- Праздники
- Приколы
- Природа
- Происшествия
- Путешествия
- Развлечения
- Ржач
- Семья
- Сериалы
- Спорт
- Стиль жизни
- ТВ передачи
- Танцы
- Технологии
- Товары
- Ужасы
- Фильмы
- Шоу-бизнес
- Юмор
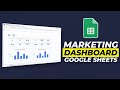
Create a Modern Interactive Dashboard in Google Sheets
Learn how to create a modern, interactive sales and marketing dashboard in Google Sheets that looks professional and updates dynamically. This step-by-step tutorial shows you how to design, build, and customize a powerful dashboard for real business insights.**
If you would like to get a copy of this Google Sheet, you can get it here:
https://leveledup.thrivecart.com/clean-sales-analytics-dashboard/
In this tutorial, you’ll learn how to build a fully interactive Google Sheets dashboard from scratch using real-world sales and marketing data. We’ll cover everything from dashboard layout and metric cards to pivot tables, sparklines, and interactive charts. By the end, you’ll have a clean, visually impressive dashboard that helps track performance and communicate insights effectively.
What You’ll Learn:
- How to design a modern and professional Google Sheets dashboard layout
- How to create metric cards, sparklines, and dynamic data visuals
- How to use pivot tables to summarize sales and marketing data
- How to build interactive charts (line, bar, pie, and progress charts)
- How to add filters, buttons, icons, and branding to your dashboard
Perfect for:
Business owners, analysts, marketers, and anyone looking to build powerful Google Sheets dashboards for sales tracking and data visualization.
Timestamps:
00:00 – How to Build an Interactive Google Sheets Dashboard That Is Professional
00:23 – How to design & setup an Interactive Dashboard In Google Sheets
06:25 – How to add metric cards to A Google Sheets Dashboard
07:49 – How to create an interactive Sparkline For Google Sheets Dashboard
09:21 – How to use Pivot Tables In A Google Sheets Interactive Dashboard
12:12 – Google Sheets Sparkline Formula For Google Sheets Dashboard
16:56 – How to create interactive sales graphs in Google Sheets Dashboard
21:08 – How to create a sales line chart in Google Sheets Dashboard
21:45 – How to create a progress chart in Google Sheets Dashboard
30:35 – Formatting Google Sheets Dashboard Card Designs
21:38 – How to create an interactive pie chart in Google Sheets Dashboard
35:17 – How to create a sales bar chart by month in Google Sheets Dashboard
37:44 – How to filter data by date in Google Sheets Dashboard
40:24 – How to add buttons to a Google Sheets Dashboard
42:09 – How to add clickable button links in Google Sheets Dashboard
43:07 – How to add a logo to a Google Sheets Dashboard
46:03 – How to add icons to your Google Sheets Dashboard
If you found this helpful, leave a comment below.
Subscribe for weekly Google Sheets tutorials on business budgeting, dashboards, and data automation.
Welcome to Sheet Metricz—your go-to channel for mastering Google Sheets and creating beautiful, data-driven dashboards. Here, we cover everything from Google Sheets tips and formulas to designing professional dashboards that make your data stand out. Whether you're a business owner, manager, or just looking to enhance your spreadsheet skills, this channel has you covered with tutorials and insights to take your Google Sheets game to the next level.
#GoogleSheets #GoogleSheetsDashboard #SalesDashboard #DataVisualization #SpreadsheetTips
Видео Create a Modern Interactive Dashboard in Google Sheets канала Sheet Metricz
google sheets dashboard google sheets sales dashboard google sheets marketing dashboard google sheets dashboard tutorial interactive dashboard google sheets google sheets data visualization google sheets charts tutorial google sheets pivot table dashboard dashboard design google sheets spreadsheet dashboard tutorial google sheets automation sales dashboard tutorial
Комментарии отсутствуют
Информация о видео
17 апреля 2026 г. 2:00:47
00:48:07
Другие видео канала