Simple Monte Carlo Simulation of Stock Prices with Python
In this tutorial, we will go over Monte Carlo simulations and how to apply them to generate randomized future prices within Python.
My Website: http://programmingforfinance.com/
Code:
#------------------------------------------------------------------------------------#
import pandas_datareader.data as web
import pandas as pd
import datetime as dt
import numpy as np
import matplotlib.pyplot as plt
from matplotlib import style
style.use('ggplot')
start = dt.datetime(2017, 01, 03)
end = dt.datetime(2017, 11, 20)
prices = web.DataReader('AAPL', 'google', start, end)['Close']
returns = prices.pct_change()
last_price = prices[-1]
#Number of Simulations
num_simulations = 1000
num_days = 252
simulation_df = pd.DataFrame()
for x in range(num_simulations):
count = 0
daily_vol = returns.std()
price_series = []
price = last_price * (1 + np.random.normal(0, daily_vol))
price_series.append(price)
for y in range(num_days):
if count == 251:
break
price = price_series[count] * (1 + np.random.normal(0, daily_vol))
price_series.append(price)
count += 1
simulation_df[x] = price_series
fig = plt.figure()
fig.suptitle('Monte Carlo Simulation: AAPL')
plt.plot(simulation_df)
plt.axhline(y = last_price, color = 'r', linestyle = '-')
plt.xlabel('Day')
plt.ylabel('Price')
plt.show()
#------------------------------------------------------------------------------------#
Видео Simple Monte Carlo Simulation of Stock Prices with Python канала codebliss
Показать
Комментарии отсутствуют
Информация о видео
Другие видео канала
 WEBCAST: Introduction to Risk and Decision Analysis using @RISK
 6. Monte Carlo Simulation
 Monte Carlo Simulation of a Stock Portfolio with Python
 Monte Carlo Simulation
 Monte Carlo Integration In Python For Noobs
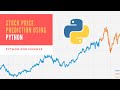 Stock Price Prediction Using Python & Machine Learning
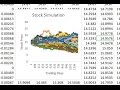 Monte Carlo Simulation of Stock Price Movement
 How to Simulate Stock Price Changes with Excel (Monte Carlo)
 A Random Walk & Monte Carlo Simulation || Python Tutorial || Learn Python Programming
![MONTE Carlo Simulation of Value at Risk (VaR) in Python [Brownian Motion]🔴](https://i.ytimg.com/vi/11YDPyTGMnc/default.jpg) MONTE Carlo Simulation of Value at Risk (VaR) in Python [Brownian Motion]🔴
MONTE Carlo Simulation of Value at Risk (VaR) in Python [Brownian Motion]🔴 Monte Carlo Prediction
 Predicting Stock Prices in Python
 Monte Carlo Simulation with Python | 2.5h Full Course | Part 4/8 | Python for Finance
 What is the Monte Carlo method? | Monte Carlo Simulation in Finance | Pricing Options
 Monte Carlo Simulation with Card Games
 R Beginner Monte Carlo Simulation
 What is a Monte Carlo Simulation?
 The Monte Carlo Method
 EXCEL- Simulation of stock prices
 Building A Probabilistic Risk Estimate Using Monte Carlo Simulations