- Популярные видео
- Авто
- Видео-блоги
- ДТП, аварии
- Для маленьких
- Еда, напитки
- Животные
- Закон и право
- Знаменитости
- Игры
- Искусство
- Комедии
- Красота, мода
- Кулинария, рецепты
- Люди
- Мото
- Музыка
- Мультфильмы
- Наука, технологии
- Новости
- Образование
- Политика
- Праздники
- Приколы
- Природа
- Происшествия
- Путешествия
- Развлечения
- Ржач
- Семья
- Сериалы
- Спорт
- Стиль жизни
- ТВ передачи
- Танцы
- Технологии
- Товары
- Ужасы
- Фильмы
- Шоу-бизнес
- Юмор
Excel PIE CHART Explained Fast
Learn when to use pie charts in Excel and how to create them in under 60 seconds. This quick tutorial covers the best practices for data visualization with pie charts, including when they work best and pros/cons. Perfect for Excel beginners who want to master chart creation fast and make their data presentations more impactful.
Best for: proportions of a whole, few categories (≤5).
✅ Pros: instantly shows share; simple and familiar.
❌ Cons: hard to compare close slices; can mislead with too many slices or 3-D effects.
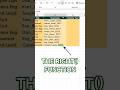
How to create: Select your table → Insert → Pie Chart → 2-D Pie.
Sample data used: Regions with Sales — North (36%), South (22%), East (16%), West (26%).
Styling tip: sort slices, label as percentages, keep total = 100%, avoid 3-D; highlight one key slice if needed.
Perfect for: market share, allocation breakdowns, simple split summaries.
Excel pie chart,
how to create pie chart in Excel,
best chart for proportions,
pie vs donut chart,
Excel chart tutorial,
chart pros and cons
#Excel #Charts #PieChart #DataViz #Spreadsheet #ExcelTips #Dashboard #Analytics
Видео Excel PIE CHART Explained Fast канала Excel Artista
Best for: proportions of a whole, few categories (≤5).
✅ Pros: instantly shows share; simple and familiar.
❌ Cons: hard to compare close slices; can mislead with too many slices or 3-D effects.
How to create: Select your table → Insert → Pie Chart → 2-D Pie.
Sample data used: Regions with Sales — North (36%), South (22%), East (16%), West (26%).
Styling tip: sort slices, label as percentages, keep total = 100%, avoid 3-D; highlight one key slice if needed.
Perfect for: market share, allocation breakdowns, simple split summaries.
Excel pie chart,
how to create pie chart in Excel,
best chart for proportions,
pie vs donut chart,
Excel chart tutorial,
chart pros and cons
#Excel #Charts #PieChart #DataViz #Spreadsheet #ExcelTips #Dashboard #Analytics
Видео Excel PIE CHART Explained Fast канала Excel Artista
Excel tutorials Excel tips Excel tricks Excel guide Excel formulas Excel functions Excel VLOOKUP Excel Macros Excel data analysis Excel chart creation Excel for beginners Excel VBA excel excel shorts excel tutorial excel training excel hacks excel how to google sheets spreadsheet tips spreadsheet hacks spreadsheets microsoft excel excel help learn excel excel basics vba how to learn excel easy excel ms excel excel formula advanced excel
Комментарии отсутствуют
Информация о видео
24 ноября 2025 г. 19:01:10
00:00:25
Другие видео канала