- Популярные видео
- Авто
- Видео-блоги
- ДТП, аварии
- Для маленьких
- Еда, напитки
- Животные
- Закон и право
- Знаменитости
- Игры
- Искусство
- Комедии
- Красота, мода
- Кулинария, рецепты
- Люди
- Мото
- Музыка
- Мультфильмы
- Наука, технологии
- Новости
- Образование
- Политика
- Праздники
- Приколы
- Природа
- Происшествия
- Путешествия
- Развлечения
- Ржач
- Семья
- Сериалы
- Спорт
- Стиль жизни
- ТВ передачи
- Танцы
- Технологии
- Товары
- Ужасы
- Фильмы
- Шоу-бизнес
- Юмор
Power BI + Causal AI: Find What ACTUALLY Drives Business Outcomes (Not Just Correlation) 🧠📊🤯
Most dashboards show correlations.
Advanced analytics explains patterns.
But the most powerful systems answer one question:
👉 What actually caused this change?
This is Causal AI with Power BI — where analytics moves from guessing to understanding cause and effect.
Here are the most important interview questions on applying Causal AI with Power BI.
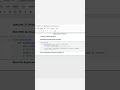
1️⃣ What is Causal AI and how is it different from correlation-based analytics?
2️⃣ How do causal models map to Power BI KPIs and business metrics?
3️⃣ How do interventions and counterfactuals work in causal analytics?
4️⃣ How are causal insights visualized and validated in Power BI dashboards?
5️⃣ Where is Causal AI already transforming real business decision-making?
Detailed answers and real logic are in the description.
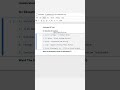
Q1: What is Causal AI and how is it different from correlation-based analytics?
Correlation answers:
👉 What moves together?
Causal AI answers:
👉 What causes what?
Example:
Correlation → Discounts and sales increased together
Causation → Discounts caused sales to increase
Causal AI focuses on cause → effect relationships, not patterns.
In Power BI, KPIs become nodes in a causal graph, not just numbers.
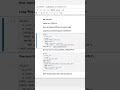
Q2: How do causal models map to Power BI KPIs and business metrics?
Business KPIs can be modeled as causal variables.
Example mapping:
Causal Variable Power BI Metric
Treatment Discount %, Ad Spend
Outcome Revenue, Conversion
Confounder Seasonality, Region
Mediator Traffic, Engagement
Example KPI in Power BI:
Revenue = SUM(Sales[Amount])
Discount = AVERAGE(Sales[DiscountPercent])
Causal models evaluate how changing Discount impacts Revenue, controlling for confounders.
Q3: How do interventions and counterfactuals work in causal analytics?
Causal AI asks “What if we had done something differently?”
This is called a counterfactual.
Example question:
“What would revenue have been if we had NOT applied the discount?”
Example Python causal inference logic:
import pandas as pd
from sklearn.linear_model import LinearRegression
df = pd.read_csv("sales_data.csv")
X = df[['Discount', 'Seasonality']]
y = df['Revenue']
model = LinearRegression()
model.fit(X, y)
# Counterfactual: discount set to 0
counterfactual = model.predict([[0, df['Seasonality'].mean()]])
print(counterfactual)
This estimates the true impact of the discount.
Q4: How are causal insights visualized and validated in Power BI dashboards?
Power BI dashboards display:
Causal effect size
Confidence intervals
Before vs After comparisons
Intervention outcomes
Example causal effect table:
Action | Estimated Impact | Confidence
Discount +10% | +18% Revenue | High
Example DAX for before/after comparison:
RevenueChange =
[Revenue_After] - [Revenue_Before]
Power BI becomes the explanation layer for causal decisions.
Q5: Where is Causal AI already transforming real business decision-making?
🛒 Pricing & Promotions
Identify which discounts actually increase profit
📈 Marketing
Separate true campaign impact from seasonal effects
🏦 Finance
Understand what really causes churn or default
🏭 Manufacturing
Identify root causes of defects, not just correlations
📊 Enterprise Analytics
Decisions based on why, not just what
Example AI-generated insight:
“Revenue increased due to discount changes, not seasonality. Causal impact estimated at +16%.”
#PowerBI #CausalAI #DecisionIntelligence #AdvancedAnalytics #MachineLearning #DataScience #BusinessIntelligence
Видео Power BI + Causal AI: Find What ACTUALLY Drives Business Outcomes (Not Just Correlation) 🧠📊🤯 канала CodeVisium
Advanced analytics explains patterns.
But the most powerful systems answer one question:
👉 What actually caused this change?
This is Causal AI with Power BI — where analytics moves from guessing to understanding cause and effect.
Here are the most important interview questions on applying Causal AI with Power BI.
1️⃣ What is Causal AI and how is it different from correlation-based analytics?
2️⃣ How do causal models map to Power BI KPIs and business metrics?
3️⃣ How do interventions and counterfactuals work in causal analytics?
4️⃣ How are causal insights visualized and validated in Power BI dashboards?
5️⃣ Where is Causal AI already transforming real business decision-making?
Detailed answers and real logic are in the description.
Q1: What is Causal AI and how is it different from correlation-based analytics?
Correlation answers:
👉 What moves together?
Causal AI answers:
👉 What causes what?
Example:
Correlation → Discounts and sales increased together
Causation → Discounts caused sales to increase
Causal AI focuses on cause → effect relationships, not patterns.
In Power BI, KPIs become nodes in a causal graph, not just numbers.
Q2: How do causal models map to Power BI KPIs and business metrics?
Business KPIs can be modeled as causal variables.
Example mapping:
Causal Variable Power BI Metric
Treatment Discount %, Ad Spend
Outcome Revenue, Conversion
Confounder Seasonality, Region
Mediator Traffic, Engagement
Example KPI in Power BI:
Revenue = SUM(Sales[Amount])
Discount = AVERAGE(Sales[DiscountPercent])
Causal models evaluate how changing Discount impacts Revenue, controlling for confounders.
Q3: How do interventions and counterfactuals work in causal analytics?
Causal AI asks “What if we had done something differently?”
This is called a counterfactual.
Example question:
“What would revenue have been if we had NOT applied the discount?”
Example Python causal inference logic:
import pandas as pd
from sklearn.linear_model import LinearRegression
df = pd.read_csv("sales_data.csv")
X = df[['Discount', 'Seasonality']]
y = df['Revenue']
model = LinearRegression()
model.fit(X, y)
# Counterfactual: discount set to 0
counterfactual = model.predict([[0, df['Seasonality'].mean()]])
print(counterfactual)
This estimates the true impact of the discount.
Q4: How are causal insights visualized and validated in Power BI dashboards?
Power BI dashboards display:
Causal effect size
Confidence intervals
Before vs After comparisons
Intervention outcomes
Example causal effect table:
Action | Estimated Impact | Confidence
Discount +10% | +18% Revenue | High
Example DAX for before/after comparison:
RevenueChange =
[Revenue_After] - [Revenue_Before]
Power BI becomes the explanation layer for causal decisions.
Q5: Where is Causal AI already transforming real business decision-making?
🛒 Pricing & Promotions
Identify which discounts actually increase profit
📈 Marketing
Separate true campaign impact from seasonal effects
🏦 Finance
Understand what really causes churn or default
🏭 Manufacturing
Identify root causes of defects, not just correlations
📊 Enterprise Analytics
Decisions based on why, not just what
Example AI-generated insight:
“Revenue increased due to discount changes, not seasonality. Causal impact estimated at +16%.”
#PowerBI #CausalAI #DecisionIntelligence #AdvancedAnalytics #MachineLearning #DataScience #BusinessIntelligence
Видео Power BI + Causal AI: Find What ACTUALLY Drives Business Outcomes (Not Just Correlation) 🧠📊🤯 канала CodeVisium
Комментарии отсутствуют
Информация о видео
12 января 2026 г. 15:42:43
00:00:10
Другие видео канала