Best Candlestick Patterns For Daytrading Forex and Stock Market | [Candlestick Patterns That Work]
__________________________________________________________________________________________
Become a member of the channel to get access to perks
Patreon:-
https://www.patreon.com/tradeprime
__________________________________________________________________________________________
In this video I am going to share 2 candlestick patterns that you can use in your trading.
But, before we start, be sure to subscribe to our channel so that you don’t miss on any of our new videos. With that being said, lets get into today's video.
Candlesticks is a type of price chart that is extremely popular among traders. The reason of this popularity is that candlesticks provide a lot of information in a very simple way.
There are many different ways of differentiating between candles. Candlesticks can be divided into two categories based on their color. Red candles and green candles. Red candles indicate down move in the market. While the green candles indicate an up move in the market.
Similarly, candles can also be differentiated on the basis of body size. Candles with big bodies and small wicks indicate a strong momentum. For instance this candle has a big body and virtually no wicks, this indicates a strong upside momentum.
On the other hand, this candle has a very small body and a relatively large wick. This indicates that the market is getting weak.
Each and every candle conveys a message. The job of the trader is to identify the message and trade accordingly.
This is where candlestick patterns come into the picture. Candlestick patterns are a set of candles that often occur in the live market. These patterns can indicate a strong reversal and provide superb opportunities to trade it.
The important point here is that we will use these patterns in conjunction with support and resistance to identify our trade setups.
Watch the full video to watch the video.
____________________________________________________________________
Ignore Tags :-
forex trading,candlestick patterns,candlestick pattern,candlestick chart,candlestick patterns for beginners,candlestick,candlestick charts,candlestick analysis,trading candlestick patterns,doji candlestick pattern,japanese candlesticks,candlesticks patterns,candlestick trading,candlestick chart patterns,candlestick patterns trading,candlestick bearish patterns,advanced candlestick patterns,candlestick patterns ka rahsya,candlesticks
candlestick patterns,best candlestick patterns,candlestick chart,candlestick,candlestick analysis,candlestick basics,candlestick chart patterns,wysetrade,candlestick patterns forex,price action,candlestick patterns explained,candlestick patterns explained with examples,price action trading strategies,price action trading
stock market,technical analysis,candlestick chart,share market,candlestick patterns,candlestick pattern,stock market for beginners,candlestick bearish patterns,candlestick patterns for beginners,candlestick analysis,stock market basics,candlestick chart basics,candlestick analysis for beginners,What Is Candlestick,What Is Candlestick Chart,Technical Analysis,Candlestick Explained,Basics Of Technical Analysis,Japanese Candlestick .
Видео Best Candlestick Patterns For Daytrading Forex and Stock Market | [Candlestick Patterns That Work] канала Trade Prime
Показать
Комментарии отсутствуют
Информация о видео
Другие видео канала
 BEST Trendline Strategies For Daytrading Forex (ADVANCED) | Trendline Secrets
 🔴 How to Use "VOLUME & CANDLESTICK" to Predict HOME RUN TRADES
 BEST Indicators For Daytrading Forex in 2021 ( Difference Between PRO vs Newbies )
 BEST Swing Trading Strategy For Daytrading Forex (High Accuracy) Simple Swing Trading Strategy
 Amazingly Simple Scalping Strategy for Daytrading Forex ( EMA + Pivots )
 BEST Bollinger Band Strategy for Daytrading forex ( Bollinger Bands Secret ) ( High Winrate )
 Price Action Secrets That Only 5% Know | (The Ultimate Guide to Price Action Trading)
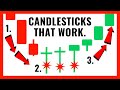 Best Candlestick Patterns (That Work)
![Support and Resistance Secrets [Hidden Secrets That Nobody Tells]](https://i.ytimg.com/vi/paLc9SArhk8/default.jpg) Support and Resistance Secrets [Hidden Secrets That Nobody Tells]
Support and Resistance Secrets [Hidden Secrets That Nobody Tells]![The "HEIKIN ASHI" Strategy That The Top 5% Use [ High Winrate ]](https://i.ytimg.com/vi/Yjy8U3NP0fM/default.jpg) The "HEIKIN ASHI" Strategy That The Top 5% Use [ High Winrate ]
The "HEIKIN ASHI" Strategy That The Top 5% Use [ High Winrate ] Highly Profitable Supply and Demand Trading Strategy For Daytrading Stocks and Forex
![How To Trade Divergences [ MUST WATCH ] | MACD And RSI Divergence Trading Strategies](https://i.ytimg.com/vi/39JAlKAcP9A/default.jpg) How To Trade Divergences [ MUST WATCH ] | MACD And RSI Divergence Trading Strategies
How To Trade Divergences [ MUST WATCH ] | MACD And RSI Divergence Trading Strategies The Easiest 1-Minute Scalping Strategy: 3-EMA Trading Strategy
 Candlestick Patterns Cheat Sheet (95% Of Traders Don't Know This)
 High-Probability Japanese Candlestick Patterns For Day Trading & Swing Trading (For Beginners)
 Simple Pullback Trading Strategy (MUST WATCH)
 Three Line Strike Candlestick Pattern for Sniper Entry (Forex)
 BEST Moving Average Strategy For Daytrading Forex (SECRET METHOD) ( Moving Average Explained )
 86% Win Rate Highly Profitable Secret Strategy | RSI + Secret Indicator
 🔴 Faster Than RSI & MACD Signals | ENGULFING Pattern Trading Strategy (TO GET SNIPER ENTRIES)