Build a TTM Squeeze Scanner in Python
In this video, we study the TTM Squeeze indicator in PineScript and create our own in Python. We first discuss this indicator visually using the chart for Target stock and observe how the squeeze is "on" when the stock enters a period of low volatility. We observe how the stock then enters a period of high volatility and makes a major move once the squeeze is off. We then write the algorithm using Python code and discuss the various components of the algorithm in doing so. The TTM Squeeze indicator uses Bollinger Bands, Keltner Channels, the ATR, and a momentum indicator / histogram. We demonstrate how we can build this indicator using the Pandas library and graph the Bollinger Bands and Keltner Channels with Plotly. We use our scanner to find some possible trading ideas for next week. Our scan indicates that Google, Visa, and Johnson & Johnson (among others) are poised to make major moves soon.
Source Code:
https://github.com/hackingthemarkets/ttm-squeeze
Buy Me a Drink: https://www.buymeacoffee.com/parttimelarry
Sign Up For TradingView: https://tradingview.go2cloud.org/SH4Gl
Sign Up For Binance: https://www.binance.us/?ref=35201287
Books: https://www.amazon.com/shop/parttimelarry
Follow Me:
Twitter: https://twitter.com/PartTimeLarry
YouTube: https://youtube.com/PartTimeLarry
Website: https://hackingthemarkets.com
Видео Build a TTM Squeeze Scanner in Python канала Part Time Larry
Показать
Комментарии отсутствуют
Информация о видео
Другие видео канала

 Finding Breakout Candidates with Python and Pandas
 The TTM Squeeze Setup: How I Made $13,000 in 2 Weeks + the 4 Keys to a CLEAN Squeeze!
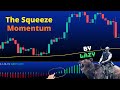 Most Popular Indicator Ever: Squeeze Momentum Indicator (by Lazybear) - Catching Breakouts Tutorial
 Tutorial: Build a Technical Screener Webapp in 100 Lines of Code
 Run a Stock Trading Bot in the Cloud using TradingView webhooks, Alpaca, Python, and AWS Lambda
 Streamlit - Building Financial Dashboards with Python
 Supertrend Part 1 - Average True Range
 Beginner Swing Trading with the TTM Squeeze
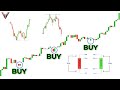 The Only Candlestick Patterns Trading Video You Will Ever Need... (Beginner To Advanced)
 Algorithmic Trading with Python and Backtrader (Part 1)
 Catch the Breakouts Before They Happen! - Learning the Squeeze Momentum Indicator
 How to Make Your Own VPN (And Why You Would Want to)
 Build a Real-Time Crypto Trading Bot in under 100 Lines of Code
 "The Squeeze" by John F. Carter - As Seen on TradeStation TradingApp Store Showcase
 TradingView Strategy Alert Webhooks with Binance API, Heroku, Python, and Flask
 How To Spot A Stock Reversal BEFORE It Happens 🚀
 Backtrader Live Forex Trading with Interactive Brokers (Part 1)
 SQUEEZE MOMENTUM SCALPING STRATEGY 5MIN - HIGH PROFIT
 The Best Indicator For Stock Trading | The Squeeze Indicator