What's it like–Getting started in Stata
Want to know how to conduct a basic data analysis using Stata? We show you just that. Watch as we show you how to import data into Stata from Excel, how to change the display format of a variable, how to label variables and the values of categorical variables, how to create new variables, how to describe and summarize variables, and how to create several kinds of graphs.
Next we demonstrate how to fit a linear regression model, how to calculate and graph marginal predictions from the model, and how to send those commands to Stata's Do-file editor. The video ends with a discussion of how to learn more about Stata using the Help files, PDF documentation, and the -search- command.
Time/Topic:
00:42 Copy and paste data from Excel to Stata
01:12 Import Excel data to Stata
02:30 Change the display format of a variable
03:31 Define and add value labels to a variable
04:54 Create a new variable
06:03 Label a variable
06:23 Describe a dataset
07:11 Summarize a dataset
08:04 Create a histogram
08:41 Create a pie chart
09:01 Create a boxplot
09:58 Fit a linear regression model
12:12 Calculate marginal predictions
13:35 Create interaction plots
14:40 Creating do-files for reproducible analyses
16:00 How to open a Help File
16:10 How to open the PDF documentation
16:16 How to search for topics
Copyright 2011-2019 StataCorp LLC. All rights reserved.
Видео What's it like–Getting started in Stata канала StataCorp LLC
Показать
Комментарии отсутствуют
Информация о видео
Другие видео канала
 Learn STATA in 15 minutes
 What is Regression? | SSE, SSR, SST | R-squared | Errors (ε vs. e)
 Teach me STATISTICS in half an hour!
 Data management: How to merge files into a single dataset
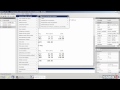 Tables and cross tabulations in Stata®
 Statistics made easy ! ! ! Learn about the t-test, the chi square test, the p value and more
 Introduction to Stata - Thinking like Stata
 Stata Presentation
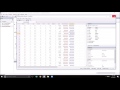 Categorical Variables in Stata
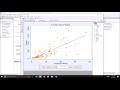 Creating and Editing Graphs in Stata
 Week 1 : GETTING STARTED WITH STATA
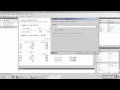 Descriptive statistics in Stata®
 Introductory STATA workshop
 Stata Basics #6: Importing data into Stata, cleaning data (also, do-files!)
 Introduction to Stata - Generating variables using the generate, replace, and label commands
 Intro to Structural Equation Modeling Using Stata
 SPSS Tutorial for data analysis | SPSS for Beginners
 Panel Data Models in Stata
 Introduction to Stata - Getting started