- Популярные видео
- Авто
- Видео-блоги
- ДТП, аварии
- Для маленьких
- Еда, напитки
- Животные
- Закон и право
- Знаменитости
- Игры
- Искусство
- Комедии
- Красота, мода
- Кулинария, рецепты
- Люди
- Мото
- Музыка
- Мультфильмы
- Наука, технологии
- Новости
- Образование
- Политика
- Праздники
- Приколы
- Природа
- Происшествия
- Путешествия
- Развлечения
- Ржач
- Семья
- Сериалы
- Спорт
- Стиль жизни
- ТВ передачи
- Танцы
- Технологии
- Товары
- Ужасы
- Фильмы
- Шоу-бизнес
- Юмор
Power BI Forecast Line Tutorial
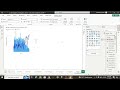
Did you know you can make some pretty neat and basic predictions in Power BI? Using a line chart, you're able to turn on a feature called Forecast. This feature allows Power BI to analyze past data, and use that to make predictions.
This feature is quite useful to present next level insights to your stakeholders. You can find the forecast line in the analytics pane in Power BI.
P.S. If you can't find the analytics pane, check if you're using the right visual, or navigate to the format tab. Power BI keeps releasing new updates. Took me some time to realise the analytics pane has been moved to the format tab.
Don't forget to leave a like, subscribe and leave a comment below if you have any questions. Cheers.
Follow me on socials
Medium: https://www.medium.com/@ibbysalam
#powerbi #dataanalytics #dataanalyticsforbeginners #datavisualization #dashboarddesign #learninpublic
Видео Power BI Forecast Line Tutorial канала Ibrahim's Notebook
Комментарии отсутствуют
Информация о видео
13 мая 2025 г. 10:53:36
00:09:10
Другие видео канала