The Right Way to Detect Outliers - Outlier Labeling Rule (part 1)
I demonstrate arguably the most valid way to detect outliers in data that roughly correspond to a normal distribution: the outlier labeling rule. I also point out that using 2.2 rather than the more common 1.5 is more appropriate as a multiplier.
The formulae I use in the video are:
Upper = Q3 + (2.2 * (Q3 - Q1))
Lower = Q1 -- (2.2 * (Q3 - Q1))
The references in video are:
Tukey, J.W. (1977). Exploratory Data Analysis. Reading, MA: Addison-Wesley.
Hoaglin, D.C., Iglewicz, B., and Tukey, J.W. (1986). Performance of some resistant rules for outlier labeling, Journal of American Statistical Association, 81, 991-999.
Hoaglin, D. C., and Iglewicz, B. (1987), Fine tuning some resistant rules for outlier labeling, Journal of American Statistical Association, 82, 1147-1149.
"outliers statistics" "statistical outlier"
Видео The Right Way to Detect Outliers - Outlier Labeling Rule (part 1) канала how2stats
Показать
Комментарии отсутствуют
Информация о видео
Другие видео канала
 The Right Way to Detect Outliers Outlier Labeling Rule (part 2)
 Boxplots & Outliers in SPSS – Identify and Deal with Outliers (4-8)
 Outlier Test
 Identifying Multivariate Outliers with Mahalanobis Distance in SPSS
 Tutorial: Data Cleaning
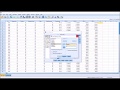 Testing the Normality of Residuals in a Regression using SPSS
 Identifying and Highlighting Outliers in Excel
 Normality Tests in SPSS
 Detecting Outliers with the Interquartile Range (IQR) and Boxplot using SPSS
 How to detect outliers in SPSS
 Dealing with an outlier - Winsorize
 Statistics 101: Is My Data Normal?
 Creating and Interpreting Boxplots in SPSS
 Identifying Outliers in SPSS
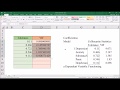 Understanding and Identifying Multicollinearity in Regression using SPSS
 Ch 3:Z Score & Outliers
 How to Find Outliers with Excel
 Detecting and dealing with outliers
 Understanding Cook's Distance in SPSS
 Removing Outliers From a Dataset