- Популярные видео
- Авто
- Видео-блоги
- ДТП, аварии
- Для маленьких
- Еда, напитки
- Животные
- Закон и право
- Знаменитости
- Игры
- Искусство
- Комедии
- Красота, мода
- Кулинария, рецепты
- Люди
- Мото
- Музыка
- Мультфильмы
- Наука, технологии
- Новости
- Образование
- Политика
- Праздники
- Приколы
- Природа
- Происшествия
- Путешествия
- Развлечения
- Ржач
- Семья
- Сериалы
- Спорт
- Стиль жизни
- ТВ передачи
- Танцы
- Технологии
- Товары
- Ужасы
- Фильмы
- Шоу-бизнес
- Юмор
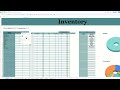
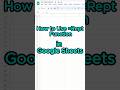
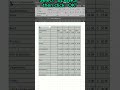
How to Create an Automated Progress Pie Chart in Google Sheets (2026) #exceltips #excel #dataextract
Tired of manually tracking your progress? Turn your static to-do lists into a dynamic dashboard! In this video, I’ll show you how to combine interactive checkboxes with a live, updating pie chart to visualize exactly how much of your project is complete.
Stop guessing your progress and start seeing it! This simple automation makes your spreadsheets work for you, giving you an instant visual update as you crush your goals. Whether you’re managing project deliverables, team action items, or personal chores, this trick will take your organization to the next level in 2026.
In this tutorial, you’ll learn:
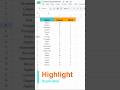
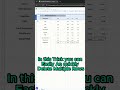
How to insert interactive checkboxes in Google Sheets.
The exact formula to link your checkbox state to a dynamic pie chart.
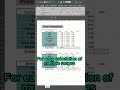
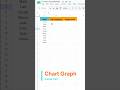
How to configure the chart to display your "Completed vs. Remaining" progress.
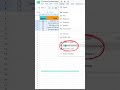
Bonus: Pro-tips for styling your dashboard to look professional.
🚀 Let’s Connect:
Subscribe for more spreadsheet efficiency tips: https://www.youtube.com/@ExcelElevate-q7f
Have a question or a specific sheet you're working on? Drop a comment below!
#GoogleSheets #SpreadsheetTips #ProductivityHacks #ProjectManagement #DataVisualization #PieChart #ExcelTutorial #2026Tips
Видео How to Create an Automated Progress Pie Chart in Google Sheets (2026) #exceltips #excel #dataextract канала Excel Elevate
Stop guessing your progress and start seeing it! This simple automation makes your spreadsheets work for you, giving you an instant visual update as you crush your goals. Whether you’re managing project deliverables, team action items, or personal chores, this trick will take your organization to the next level in 2026.
In this tutorial, you’ll learn:
How to insert interactive checkboxes in Google Sheets.
The exact formula to link your checkbox state to a dynamic pie chart.
How to configure the chart to display your "Completed vs. Remaining" progress.
Bonus: Pro-tips for styling your dashboard to look professional.
🚀 Let’s Connect:
Subscribe for more spreadsheet efficiency tips: https://www.youtube.com/@ExcelElevate-q7f
Have a question or a specific sheet you're working on? Drop a comment below!
#GoogleSheets #SpreadsheetTips #ProductivityHacks #ProjectManagement #DataVisualization #PieChart #ExcelTutorial #2026Tips
Видео How to Create an Automated Progress Pie Chart in Google Sheets (2026) #exceltips #excel #dataextract канала Excel Elevate
Комментарии отсутствуют
Информация о видео
17 июня 2026 г. 17:38:35
00:00:36
Другие видео канала