- Популярные видео
- Авто
- Видео-блоги
- ДТП, аварии
- Для маленьких
- Еда, напитки
- Животные
- Закон и право
- Знаменитости
- Игры
- Искусство
- Комедии
- Красота, мода
- Кулинария, рецепты
- Люди
- Мото
- Музыка
- Мультфильмы
- Наука, технологии
- Новости
- Образование
- Политика
- Праздники
- Приколы
- Природа
- Происшествия
- Путешествия
- Развлечения
- Ржач
- Семья
- Сериалы
- Спорт
- Стиль жизни
- ТВ передачи
- Танцы
- Технологии
- Товары
- Ужасы
- Фильмы
- Шоу-бизнес
- Юмор
Visual CUT Web Reports
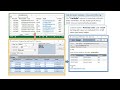
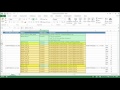
Data sources for interactive Web Grids, Web Schedules, and Web Pivots can can be Crystal Reports or Excel Workbooks.
Demo of 5 types of web reporting supported by Visual CUT. These include: auto-refreshing web reports, multi-panel web dashboards, Web Grids, Web Schedules, and Web pivot tables/charts with master & user-defined report layouts.
1:21 Auto-Refreshing Web Reports
3:43 Web Dashboards with Multiple Panels
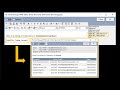
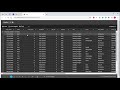
4:34 Web Grid
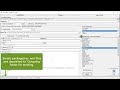
7:04 Web Schedule (Calendar)
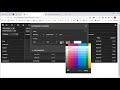
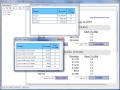
8:03 Web Pivot Tables/Charts (+ saved layouts)
PowerPoint Slides: https://milletsoftware.com/Download/Visual_CUT_Web_Reports.pptx
Auto-Refreshing Web Report: https://www.milletsoftware.com/Revenue_and_Delivery_By_Employee.html
Multi-Panel Web Dashboard: https://www.milletsoftware.com/Visual_CUT_Multi_Panel_Dashboard.html
Multi-Panel Web Dashboard with Drill-Across: https://www.milletsoftware.com/Visual_CUT_Multi_Panel_DrillDown_Dashboard.html
Web Grid Video Demo: https://youtu.be/wDrc3ZDv5bc
Web Grid Sample: https://www.milletsoftware.com/Data/WebGrid_Demo_AsOf.html
Web Schedule (Calendar) Sample: https://www.milletsoftware.com/Data/Web_Schedule.html
Web Pivot Table/Charts Video Demo (without Report Layouts): https://youtu.be/Ga_14vjDSfc
Web Pivot Table/Charts Sample: https://www.milletsoftware.com/Data/Sales.html
Видео Visual CUT Web Reports канала Millet Software
Demo of 5 types of web reporting supported by Visual CUT. These include: auto-refreshing web reports, multi-panel web dashboards, Web Grids, Web Schedules, and Web pivot tables/charts with master & user-defined report layouts.
1:21 Auto-Refreshing Web Reports
3:43 Web Dashboards with Multiple Panels
4:34 Web Grid
7:04 Web Schedule (Calendar)
8:03 Web Pivot Tables/Charts (+ saved layouts)
PowerPoint Slides: https://milletsoftware.com/Download/Visual_CUT_Web_Reports.pptx
Auto-Refreshing Web Report: https://www.milletsoftware.com/Revenue_and_Delivery_By_Employee.html
Multi-Panel Web Dashboard: https://www.milletsoftware.com/Visual_CUT_Multi_Panel_Dashboard.html
Multi-Panel Web Dashboard with Drill-Across: https://www.milletsoftware.com/Visual_CUT_Multi_Panel_DrillDown_Dashboard.html
Web Grid Video Demo: https://youtu.be/wDrc3ZDv5bc
Web Grid Sample: https://www.milletsoftware.com/Data/WebGrid_Demo_AsOf.html
Web Schedule (Calendar) Sample: https://www.milletsoftware.com/Data/Web_Schedule.html
Web Pivot Table/Charts Video Demo (without Report Layouts): https://youtu.be/Ga_14vjDSfc
Web Pivot Table/Charts Sample: https://www.milletsoftware.com/Data/Sales.html
Видео Visual CUT Web Reports канала Millet Software
Комментарии отсутствуют
Информация о видео
24 декабря 2021 г. 7:23:19
00:18:31
Другие видео канала