Statistics in Research - Introduction, Types, Variables, Frequency Distribution, Skewness, Kurtosis
Dr. Manishika Jain in this video explains the frequency distribution
30 Students and Stress rating of all
The 30 students’ scores (their ratings on the scale) are: 8, 7, 4, 10, 8, 6, 8, 9, 9, 7, 3, 7, 6, 5, 0, 9, 10, 7, 7, 3, 6, 7, 5, 2, 1, 6, 7, 10, 8, 8.
frequency table because it shows how frequently (how many times) each score was used (mark from lowest to highest values, mark scores, from lowest to highest) - makes it easy to see the pattern in a large group of scores
A frequency table that uses intervals is called a grouped frequency table. – information more directly understandable (inclusive series and exclusive series)
Histogram: barlike graph of a frequency distribution in which the values are plotted along the horizontal axis and the height of each bar is the frequency of that value; the bars are usually placed next to each other without spaces, giving the appearance of a city skyline
Complete Online Crash Course - https://www.doorsteptutor.com/Exams/UGC/Paper-1/Online-Crash-Course/
Postal Course - https://www.examrace.com/NTA-UGC-NET/NTA-UGC-NET-FlexiPrep-Program/Postal-Courses/Examrace-NTA-UGC-NET-Paper-I-Series.htm
Mock papers - https://www.doorsteptutor.com/Exams/UGC/Paper-1/Online-Test-Series/
Practice questions - https://www.doorsteptutor.com/Exams/UGC/Paper-1/Questions/
NET Paper 1 Playlist - https://www.youtube.com/playlist?list=PLW9kB_HKs3_NCXcqf9tBCUh5uYD1aBg6W
More interesting topics subscribe at TestPrep: https://www.youtube.com/c/TestPrep
NCERT, Yojana, Kurukshetra, Down to Earth, Science, Social Studies and More interesting topics subscribe at ExamraceHindi: https://www.youtube.com/c/ExamraceHindi
For kids videos subscribe to FunProf: https://www.youtube.com/c/FunProf
For Science Class 11-12 and important topics subscribe to DoorStepTutor: https://www.youtube.com/c/DoorstepTutor
Statistics @0:07
SPSS (Statistical Package for the Social Sciences)@1:47
Types of Statistics @2:19
Descriptive Statistics @2:33
Interpreting Statistics @2:52
Variable, Value and Score @3:33
Level of Measurement @6:37
Equal – Interval Variable @6:50
Ratio Scale @7:25
Rank – Order Variable @8:54
Nominal Variable @9:14
Types of Variable @10:05
Discrete Variable @10:27
Continuous Variable @11:02
Discrete Variable & Continuous Variable @12:26
Frequency Table @13:08
Histogram @15:28
Grouped Frequency Table @16:26
India: Estimated Total Population from 2014 to 2024 (In Millions) @17:37
Unimodal, Bimodal and Multimodal @18:23
Types of Distribution @20:03
Symmetrical Distribution @20:11
Skewed Distribution @20:41
Floor Effect @22:56
Ceiling Effect @23:33
Kurtosis @24:02
Misleading Graphs @24:46
#Skewed #Histogram #Discrete #Measurement #Predictions #Inferential #Descriptive #Interpreting #Taxation #Misleading #Manishika #Examrace
Видео Statistics in Research - Introduction, Types, Variables, Frequency Distribution, Skewness, Kurtosis канала Examrace
Показать
Комментарии отсутствуют
Информация о видео
Другие видео канала
 📈 Measures of Central Tendency - Mean, Mode, Median, Variance, Standard Deviation | Statistics
 Research Methodology (Part 3 of 3): 28 Types of Variables - Independent & Dependent Variables
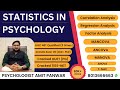 Statistics in Psychology | Correlation, Regression Analysis, Factor Analysis, t-test, ANOVA & ANCOVA
 Statistics In Research Introduction - Skewness and Kurtosis - Part 6 of 6
 Skewness and Kurtosis | Skewness | Kurtosis | Non-Normal Distribution in Statistics | NTA-UGC NET
 Inferential Statistics: Z-Score, Sample, Population, Normal Curve, Probability
 What is Hypothesis? (Part 1 of 2) 13 Types of Hypothesis (Null & Alternative) - Research Methodology
 Frequency Tables
 Class 12 Students! CUET 2022: Common University Entrance Test- UGC Surprise | NCERT Weightage Rises
 Teach me STATISTICS in half an hour!
 (V- 19) Difference between Inferential statistics and Descriptive statistics | Types of Statistics
 Steps of Writing Review of literature || Nursing Research
 Introduction to research methods and methodologies
 Sampling & its 8 Types (Probability & Non-Probability Sampling): Research Methodology
 REVIEW OF LITERATURE || NURSING RESEARCH
 Nursing research#Research#Research Problem#Topic-VARIABLES#unit-3#class-21#Nursing officer#
 Statistics in Research | Research Aptitude for NTA UGC NET Paper 1 | Kumar Bharat
 What is Statistics? | Descriptive Statistics vs Inferential Statistics | Types of Statistics |
 Statistics For Economics Class-11 # Introduction